

Answered step by step
Verified Expert Solution
Question
1 Approved Answer
Find the Investment Ratios. Net Revenues Financial Year Minimum Estimated Net Revenue in the Ordinance (HKSmi () Actual Net Revenue/Deficit) (HK$m) 5 () Shortfall (HK$m)
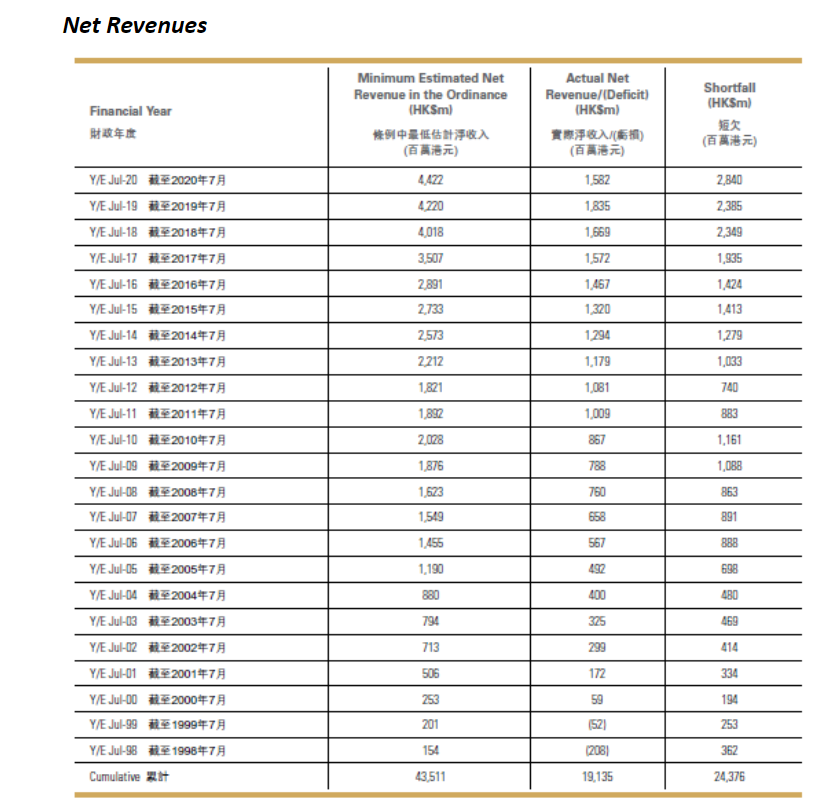
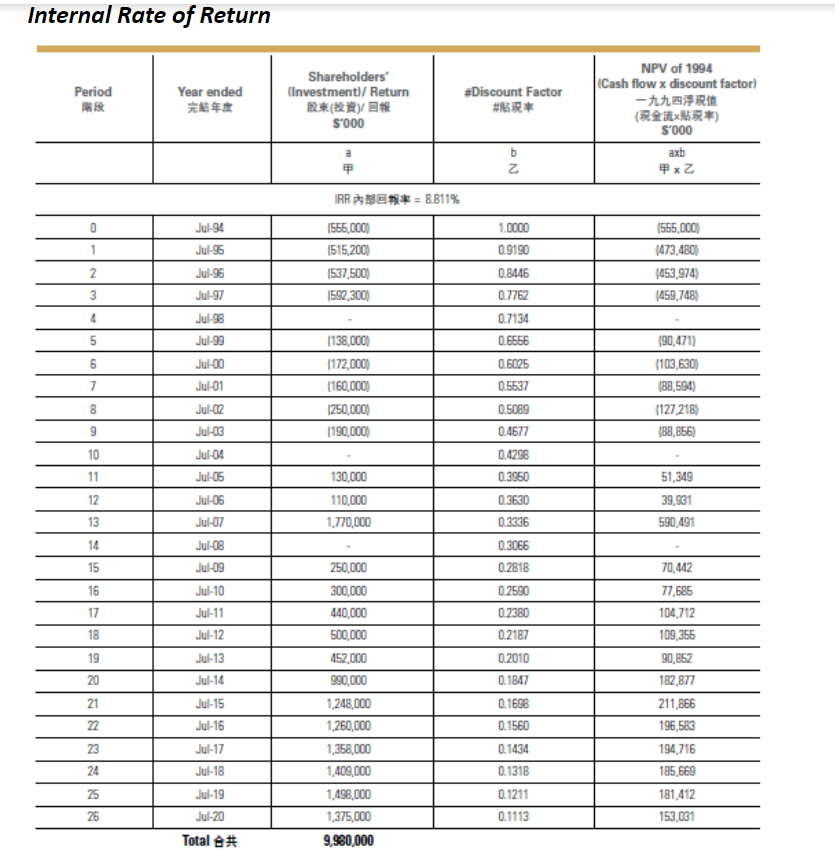
Find the Investment Ratios.
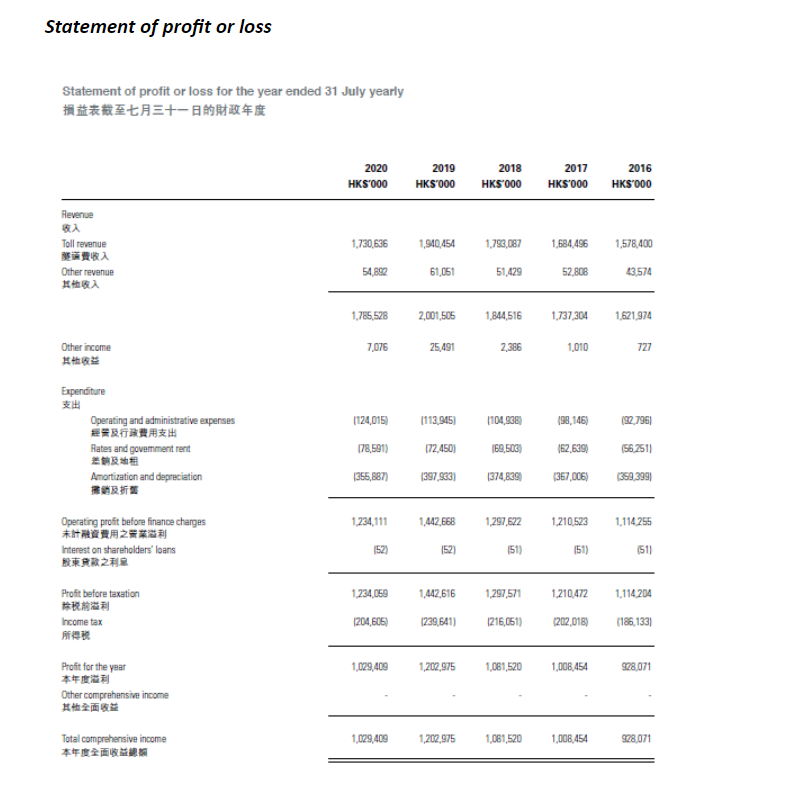
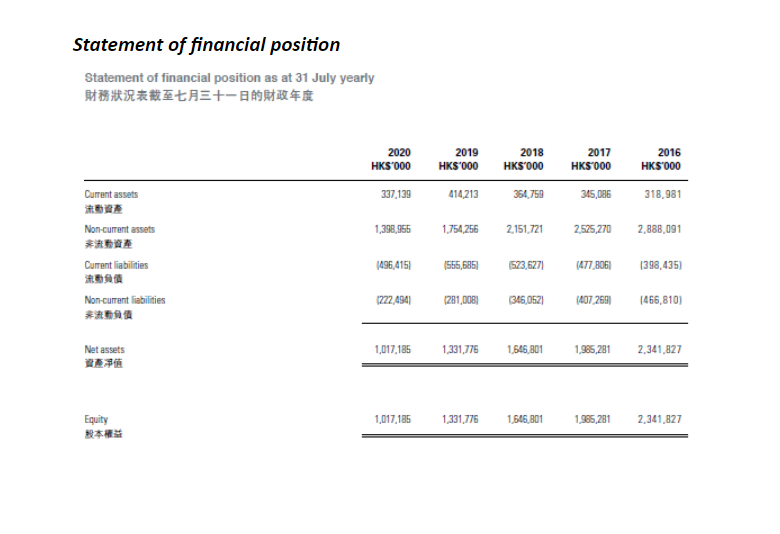
Net Revenues Financial Year Minimum Estimated Net Revenue in the Ordinance (HKSmi () Actual Net Revenue/Deficit) (HK$m) 5 () Shortfall (HK$m) ) 1.582 2,840 4.422 4220 1.835 2,385 4,018 1,669 2,349 1,935 3507 2,891 2.733 1,572 1,467 1.424 1,413 1320 2573 1294 1,279 1,033 1.179 2212 1.821 1,081 740 1,009 883 1892 2,028 1876 867 1.161 1,088 YE JU-20 20207 YE JU-19 20197 YE JU-18 20187 YE JU-17 20177 YE JU-16 20167 YE JU-15 20157 YE JU-14 20147 YE JU-13 20137 YE Ju-12 20127 YE JL-11 20117 YE JL-10 20107 YEJU-09 20097 YE JU-DR 20087 YE Ju20077 YE JU-06 20067 YE Jul 05 20057 YE Juld 20047 YE JU-3 20037 YEJU-2 20027 YE JU-11 20017 YE JU-00 20007 YE JU-99 19997 YE JH-8 19967 Cumulative 2 788 750 863 1,623 1,549 658 891 1.455 567 39 1.190 698 492 400 880 ABO 794 325 469 713 299 414 506 172 334 253 201 154 59 (521 194 253 (2081 362 43,511 19,135 24,375 Internal Rate of Return Period Year ended Shareholders' (Investment/ Return () S'000 #Discount Factor #R* NPV of 1994 Cash flow x discount factor) x) S-000 axb x2 a b Z IRREN*= 8.811% 1555,000 1515,200 1537,500) 1592,300) (555,000 (473,480) 1453,974) 1459,748) 2 3 4 5 6 7 [138,000) [172,000 [160,000 1250,000 (190,000) 190,471) (103,630) (88,594) (127,218) (88,856) 8 10 11 12 13 130,000 110,000 1,770,000 Jul-94 Jul-96 Jul-96 Jul-97 Jul-98 Jul-99 Jul-00 Jul-01 Jul-02 Jul-03 Jul-04 Jul-05 Jul-05 Jul-07 Jul-08 Jul-09 Jul-10 Jul-11 Jul-12 Jul-13 Jul 14 Jul 15 Jul-16 Jul-17 Jul-18 Jul-19 Jul-20 Total # 1.0000 0.9190 0.8446 0.7762 0.7134 0.6566 0.6025 0.5537 0.5089 0.4677 0.4298 0.3960 0.3630 0.3336 0.3066 0.2818 0.2590 0.2380 0.2187 0.2010 0.1847 0.1698 0.1560 0.1434 0.1318 0.1211 0.1113 51,349 39,931 590,491 14 15 16 17 18 19 20 250,000 300,000 440,000 500,000 452,000 990,000 1,248,000 1,260,000 1,358,000 1,409,000 1,498,000 1,375,000 9,960,000 70,442 77,685 104,712 109,355 90,852 182,877 211,866 196,583 194,716 185,669 181,412 153,031 21 22 23 24 25 26 Statement of profit or loss Statement of profit or loss for the year ended 31 July yearly 2020 HKS000 2019 HK$000 2018 HKS-000 2017 2016 | HKS000 HKS00 1,730,636 Revenge Toll revenue Other revenue 1,940.454 1,793,087 1,684,496 1,578.400 54,892 61,051 51,429 52,808 13.574 1,785.528 2,001,505 1,844,516 1,737,304 1,621,974 7,076 25.491 2,386 Other income 1,010 1124,015 [113,945) 1104,938 (98,146) (92,796 Expenditure Operating and administrative expenses Rates and goverment rent Amortization and depreciation 178,591) 172.4501 160,503 699 (56.2511 356,887) (397,923) 1374,839) 367.CC) 359,399 1234,111 1,442,668 1.297,622 1.210.523 1.114255 Operating profit before finance charges Interest on shareholders' loans 152) (52) 151) 151) 1511 1.234,059 1,442,616 1.297,571 1.210,472 1.114204 Profit before taxation Income tax COM ECB) 1239,641) 1216,051) 202,018) (186,1331 1,029,409 1,202,975 1,081,520 1,008,454 928.071 Profit for the year Other comprehensive income 1,029,409 1,202,975 1,081,520 1,008,454 928.071 Total comprehensive income Statement of financial position Statement of financial position as at 31 July yearly 2020 HK$7000 2019 HK$7000 2018 HK$7000 2017 HK$ 000 2016 HKS 000 337,139 414,213 354759 345,086 318,981 1,398,955 1,754,256 2,151,721 2.525,270 2.3E6.01 Current assets Non-current assets Current liabilities Non-cument liabilities 1496415) 1556,685) 1573,6271 (477 806 398,435) 1222,494 (281,008) (346,0521 (407 269 (466,810) 1,017,185 1,331,775 1.546.801 1,965,281 Net assets 2,341,827 1,017,185 1331,775 1,646 801 1965,281 2.341,827 Equity Net Revenues Financial Year Minimum Estimated Net Revenue in the Ordinance (HKSmi () Actual Net Revenue/Deficit) (HK$m) 5 () Shortfall (HK$m) ) 1.582 2,840 4.422 4220 1.835 2,385 4,018 1,669 2,349 1,935 3507 2,891 2.733 1,572 1,467 1.424 1,413 1320 2573 1294 1,279 1,033 1.179 2212 1.821 1,081 740 1,009 883 1892 2,028 1876 867 1.161 1,088 YE JU-20 20207 YE JU-19 20197 YE JU-18 20187 YE JU-17 20177 YE JU-16 20167 YE JU-15 20157 YE JU-14 20147 YE JU-13 20137 YE Ju-12 20127 YE JL-11 20117 YE JL-10 20107 YEJU-09 20097 YE JU-DR 20087 YE Ju20077 YE JU-06 20067 YE Jul 05 20057 YE Juld 20047 YE JU-3 20037 YEJU-2 20027 YE JU-11 20017 YE JU-00 20007 YE JU-99 19997 YE JH-8 19967 Cumulative 2 788 750 863 1,623 1,549 658 891 1.455 567 39 1.190 698 492 400 880 ABO 794 325 469 713 299 414 506 172 334 253 201 154 59 (521 194 253 (2081 362 43,511 19,135 24,375 Internal Rate of Return Period Year ended Shareholders' (Investment/ Return () S'000 #Discount Factor #R* NPV of 1994 Cash flow x discount factor) x) S-000 axb x2 a b Z IRREN*= 8.811% 1555,000 1515,200 1537,500) 1592,300) (555,000 (473,480) 1453,974) 1459,748) 2 3 4 5 6 7 [138,000) [172,000 [160,000 1250,000 (190,000) 190,471) (103,630) (88,594) (127,218) (88,856) 8 10 11 12 13 130,000 110,000 1,770,000 Jul-94 Jul-96 Jul-96 Jul-97 Jul-98 Jul-99 Jul-00 Jul-01 Jul-02 Jul-03 Jul-04 Jul-05 Jul-05 Jul-07 Jul-08 Jul-09 Jul-10 Jul-11 Jul-12 Jul-13 Jul 14 Jul 15 Jul-16 Jul-17 Jul-18 Jul-19 Jul-20 Total # 1.0000 0.9190 0.8446 0.7762 0.7134 0.6566 0.6025 0.5537 0.5089 0.4677 0.4298 0.3960 0.3630 0.3336 0.3066 0.2818 0.2590 0.2380 0.2187 0.2010 0.1847 0.1698 0.1560 0.1434 0.1318 0.1211 0.1113 51,349 39,931 590,491 14 15 16 17 18 19 20 250,000 300,000 440,000 500,000 452,000 990,000 1,248,000 1,260,000 1,358,000 1,409,000 1,498,000 1,375,000 9,960,000 70,442 77,685 104,712 109,355 90,852 182,877 211,866 196,583 194,716 185,669 181,412 153,031 21 22 23 24 25 26 Statement of profit or loss Statement of profit or loss for the year ended 31 July yearly 2020 HKS000 2019 HK$000 2018 HKS-000 2017 2016 | HKS000 HKS00 1,730,636 Revenge Toll revenue Other revenue 1,940.454 1,793,087 1,684,496 1,578.400 54,892 61,051 51,429 52,808 13.574 1,785.528 2,001,505 1,844,516 1,737,304 1,621,974 7,076 25.491 2,386 Other income 1,010 1124,015 [113,945) 1104,938 (98,146) (92,796 Expenditure Operating and administrative expenses Rates and goverment rent Amortization and depreciation 178,591) 172.4501 160,503 699 (56.2511 356,887) (397,923) 1374,839) 367.CC) 359,399 1234,111 1,442,668 1.297,622 1.210.523 1.114255 Operating profit before finance charges Interest on shareholders' loans 152) (52) 151) 151) 1511 1.234,059 1,442,616 1.297,571 1.210,472 1.114204 Profit before taxation Income tax COM ECB) 1239,641) 1216,051) 202,018) (186,1331 1,029,409 1,202,975 1,081,520 1,008,454 928.071 Profit for the year Other comprehensive income 1,029,409 1,202,975 1,081,520 1,008,454 928.071 Total comprehensive income Statement of financial position Statement of financial position as at 31 July yearly 2020 HK$7000 2019 HK$7000 2018 HK$7000 2017 HK$ 000 2016 HKS 000 337,139 414,213 354759 345,086 318,981 1,398,955 1,754,256 2,151,721 2.525,270 2.3E6.01 Current assets Non-current assets Current liabilities Non-cument liabilities 1496415) 1556,685) 1573,6271 (477 806 398,435) 1222,494 (281,008) (346,0521 (407 269 (466,810) 1,017,185 1,331,775 1.546.801 1,965,281 Net assets 2,341,827 1,017,185 1331,775 1,646 801 1965,281 2.341,827 EquityStep by Step Solution
There are 3 Steps involved in it
Step: 1

Get Instant Access to Expert-Tailored Solutions
See step-by-step solutions with expert insights and AI powered tools for academic success
Step: 2

Step: 3
Ace Your Homework with AI
Get the answers you need in no time with our AI-driven, step-by-step assistance
Get Started
The Risk Modeling Evaluation Handbook Rethinking Financial Risk Management Methodologies In The Global Capital Markets
Authors: Greg Gregoriou, Christian Hoppe, Carsten Wehn
1st Edition
0071663703, 978-0071663700