Answered step by step
Verified Expert Solution
Link Copied!

Question

1 Approved Answer

FIND THE LAST 3 parts The following table, contains annual returns for the stocks of ABC Corp. (ABC) and Company B (B). The returns are

FIND THE LAST 3 partsimage text in transcribed

The following table, contains annual returns for the stocks of ABC Corp. (ABC) and Company B (B). The returns are calculated using end-of-year prices (adjusted for dividends and stock splits) retrieved from http://www.finance.yahoo.com/. Use Excel to create a spreadsheet that calculates the return that an equally-weighted portfolio of these two stocks would have eamed in each year. Then, calculate the average return and standard deviation for each stock over this period. Next, the average retum and standard deviation for a portfolio that invests 50% in HD and 50% in LOW. What is the correlation between HD and LOW returns over this period? The average portfolio return for 2010 is 17.30 %. (Enter as a percentage and round to two decimal places.) Data Table The average portfolio return for 2011 is 14.35 %. (Enter as a percentage and round to two decimal places.) The average portfolio return for 2012 is 46.95 %. (Enter as a percentage and round to two decimal places.) (Click on the loon here in order to copy its contents of the data table below into a spreadsheet.) The average portfolio return for 2013 is 37.75 %. (Enter as a percentage and round to two decimal places.) The average portfolio return for 2014 is 34.05 %. (Enter as a percentage and round to two decimal places.) The average portfolio return for 2015 is 19.00 %. (Enter as a percentage and round to two decimal places.) The average portfolio return for 2016 is 2.75 %. (Enter as a percentage and round to two decimal places.) The average portfolio return for 2017 is 36.50 %. (Enter as a percentage and round to two decimal places.) Year 2005 2006 2007 2008 2009 2010 2011 2012 2013 2014 2015 2016 2017 ABC Retums -3.1% 2.4% - 30.7% - 12.4% 30.1% 25.1% 23.8% 51.7% 35.1% 29.4% 26.2% 5.8% 45.2% B Returns 17.3% -6.7% - 26.1% -3.1% 11.7% 9.5% 4.9% 42.2% 40.4% 38.7% 11.8% -0.3% 27.8% The average annual return for ABC Corp. over this period is 17.58%. (Enter as a percentage and round to two decimal places.) The average annual return for Company B over this period is 12.93 %. (Enter as a percentage and round to two decimal places. The standard deviation for ABC Corp. over this period is 22.75%. (Enter as a percentage and round to two decimal places.) The standard deviation for Company B over this period is 19.04 %. (Enter as a percentage and round to two decimal places.) The average annual return for a portfolio that invests 50% in HD and 50% in LOW over this period is %. (Enter as a percentag ( Print ) Print Done The standard deviation for a portfolio that invests 50% in HD and 50% in LOW over this period is %. Enter as a percentage ar The correlation between HD and LOW returns over this period is. (Round to two decimal places.)

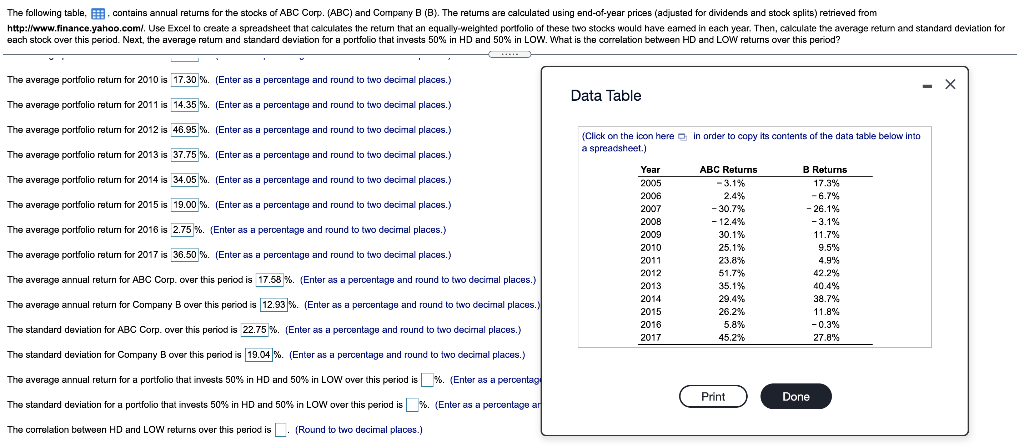
Step by Step Solution

There are 3 Steps involved in it

Step: 1

blur-text-image

Get Instant Access to Expert-Tailored Solutions

See step-by-step solutions with expert insights and AI powered tools for academic success

Step: 2

blur-text-image

Step: 3

blur-text-image

Ace Your Homework with AI

Get the answers you need in no time with our AI-driven, step-by-step assistance

Get Started

Students also viewed these Finance questions

Question

I just need it solved.

Answered: 1 week ago