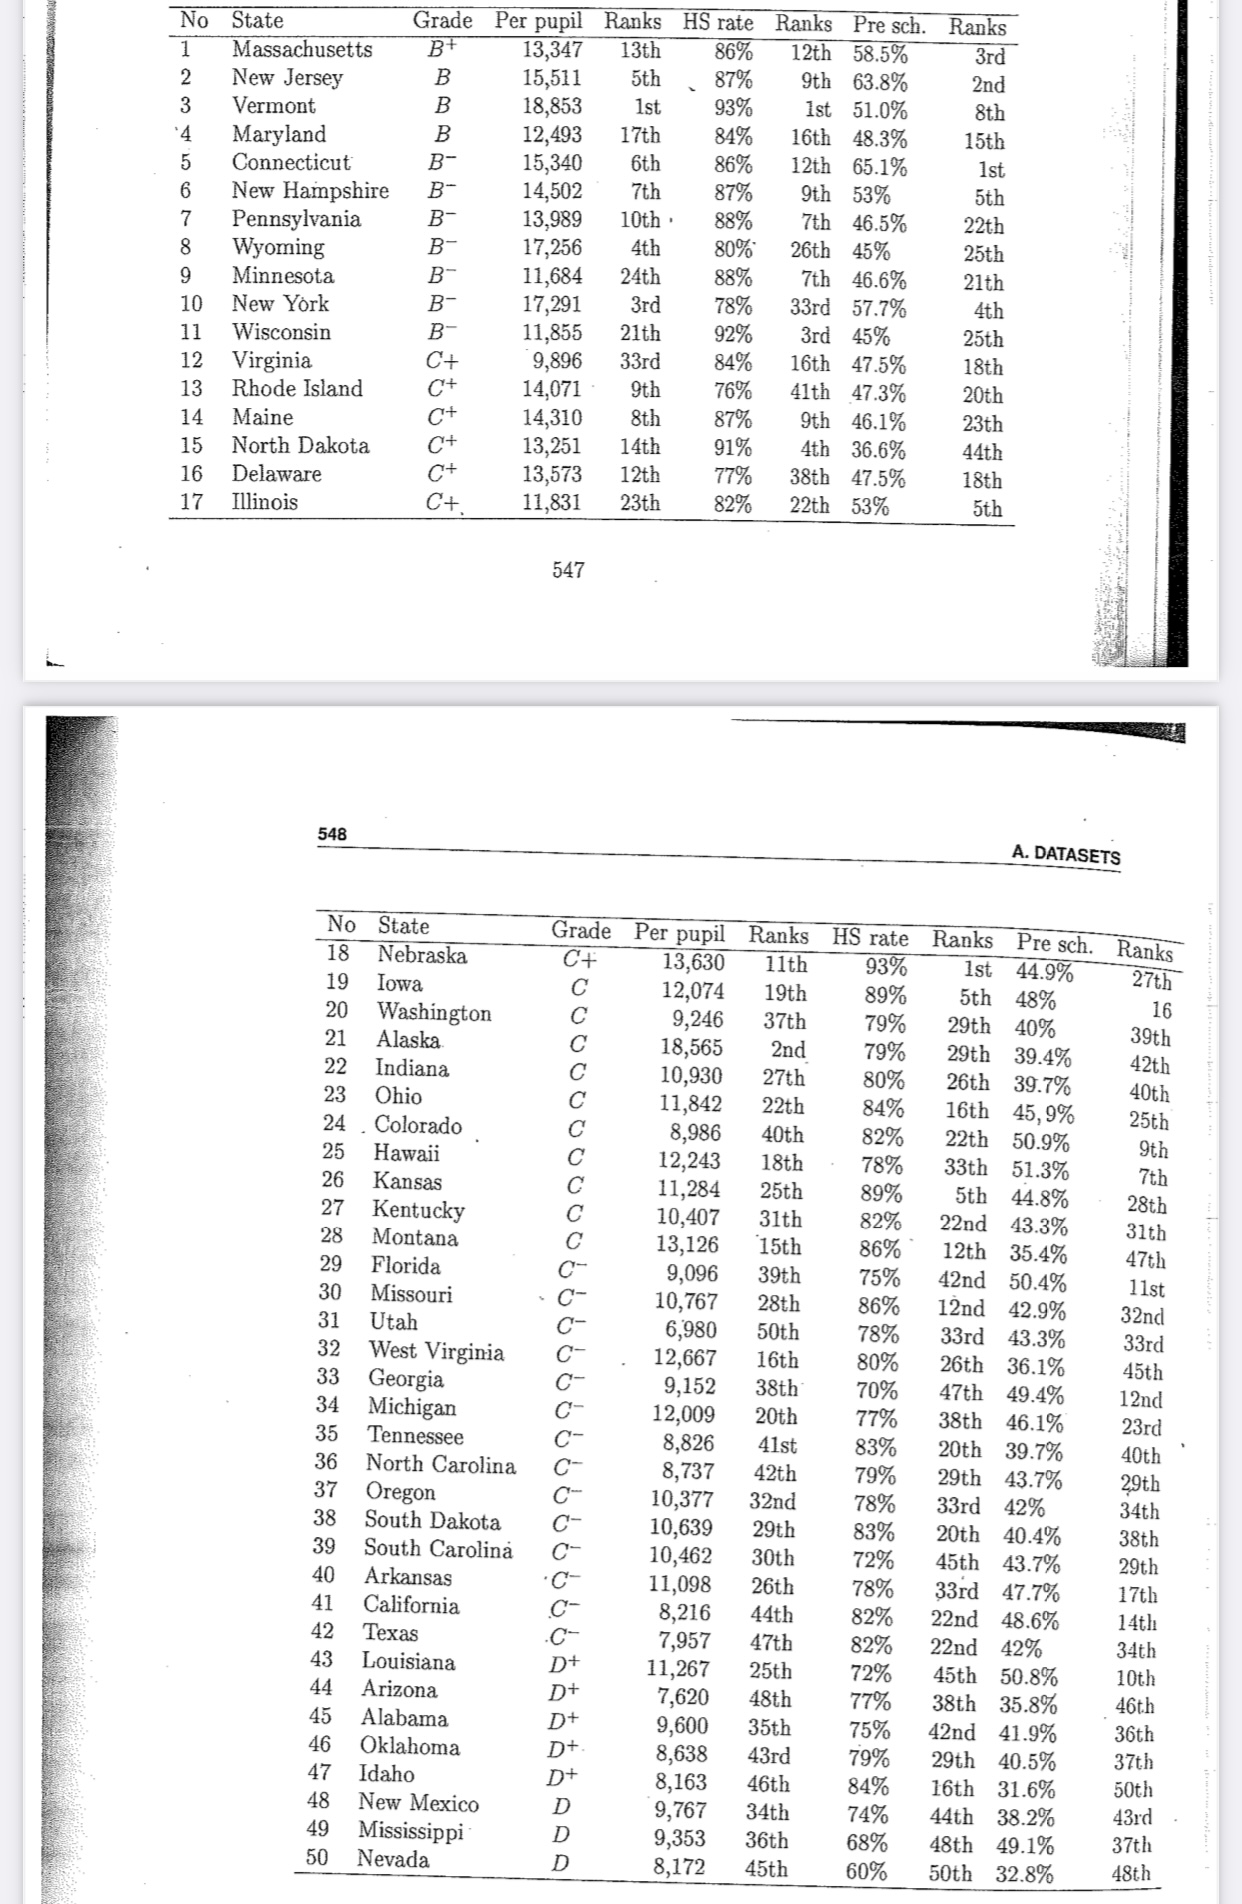
Find the mean, mode, and standard deviation of column 3 (per pupil column)
Construct a pie chart and bar graph in excel or SPSS of the relative frequency of all grades (so for all Bs, B-s, B+s, C-, C+, C, D+, D etc)
please attach pics of excel or SPSS outputs
Ranks Pre sch. Ranks No State Grade Per pupil Ranks HS rate B+ 13,347 13th 36% 12th 58.5% 3rd Massachusetts 15,511 5th 2nd New Jersey B 87% 9th 63.8% B 18,853 1st 93% 1st 51.0% 8th Vermont B 12,493 17th 84% 16th 48.3% 15th Maryland V OCT. A CO NO Connecticut B- 15,340 6th 86% 12th 65.1% 1st New Hampshire B- 14,502 7th 87% 9th 53% 5th Pennsylvania B- 13,989 10th . 88% 7th 46.5% 22th B- 17,256 4th 80% 26th 45% 25th 8 Wyoming B- 11,684 24th 88% 7th 46.6% 21th Minnesota 10 New York B- 17,291 3rd 78% 33rd 57.7% 4th 11 Wisconsin B- 11,855 21th 92% 3rd 45% 25th 12 Virginia C+ 9,896 33rd 84% 16th 47.5% 18th Rhode Island C+ 14,071 9th 76% 20th 13 41th 47.3% C+ 14,310 8th 23th 14 Maine 87% 9th 46.1% 15 North Dakota C+ 13,251 14th 91% 4th 36.6% 44th 16 C+ 13,573 12th 77% 38th 47.5% 18th Delaware 7 Illinois C+. 11,831 23th 82% 22th 53% 5th 547 548 A. DATASETS No State Grade Per pupil Ranks HS rate Ranks Pre sch. Ranks 18 Nebraska C+ 13,630 11th 93% Ist 44.9% 27th 19 Iowa 12,074 19th 39% 5th 48% 16 20 Washington 9,246 37th 79% 29th 40% 39th 21 Alaska 18,565 2nd 79% 29th 39.4% 42th 22 Indiana 10,930 27th 80% 26th 39.7% 40th 23 Ohio 11,842 22th 84% 16th 45, 9% 25th 24 . Colorado 8,986 40th 82% 22th 50.9% 9th 25 Hawaii 12,243 18th 78% 33th 51.3% 7th 26 Kansas 11,284 25th 89% 5th 44.8% 28th 27 Kentucky 10.407 31th 82% 22nd 43.3% 31th 28 Montana 13,126 15th 86% 12th 35.4% 47th 29 Florida 9,096 39th 75% 42nd 50.4% 11st 30 Missouri 10,767 28th 86% 12nd 42.9% 32nd 31 Utal 6,980 50th 78% 33rd 43.3% 33rd 32 West Virginia 12,667 16th 80% 26th 36.1% 45th 33 Georgia 9,152 38th 70% 47th 49.4% 12nd 34 Michigan 12,009 20th 77% 38th 46.1% 23rd 35 Tennessee 8.826 41st 83% 20th 39.7% 40th 36 North Carolina 8,737 42th 79% 29th 43.7% 29th 37 Oregon 10,377 32nd 78% 33rd 42% 34th 38 South Dakota 10,639 29th 83% 20th 40.4% 38th 39 South Carolina 10,462 30th 72% 15th 43.7% 29th 40 Arkansas 11,098 26th 78% 33rd 47.7% 17th 41 California 8,216 44th 32% 22nd 48.6% 14th 42 Texas 7,957 47th 82% 22nd 42% 34th 43 Louisiana D+ 11,267 25th 72% 45th 50.8% 10th 44 Arizona D+ 7,620 48th 77% 38th 35.8% 16th 45 Alabama D+ 9,600 35th 75% 42nd 41.9% 36th 46 Oklahoma D+ 8,638 43rd 79% 29th 40.5% 37th 47 Idaho D+ 8,163 46th 84% 16th 31.6% 50th 48 New Mexico D 9,767 34th 74% 44th 38.2% 43rd 49 Mississippi 9,353 36th 68% 48th 49.1% 37th 50 Nevada 8,172 45th 60% 50th 32.8% 48th