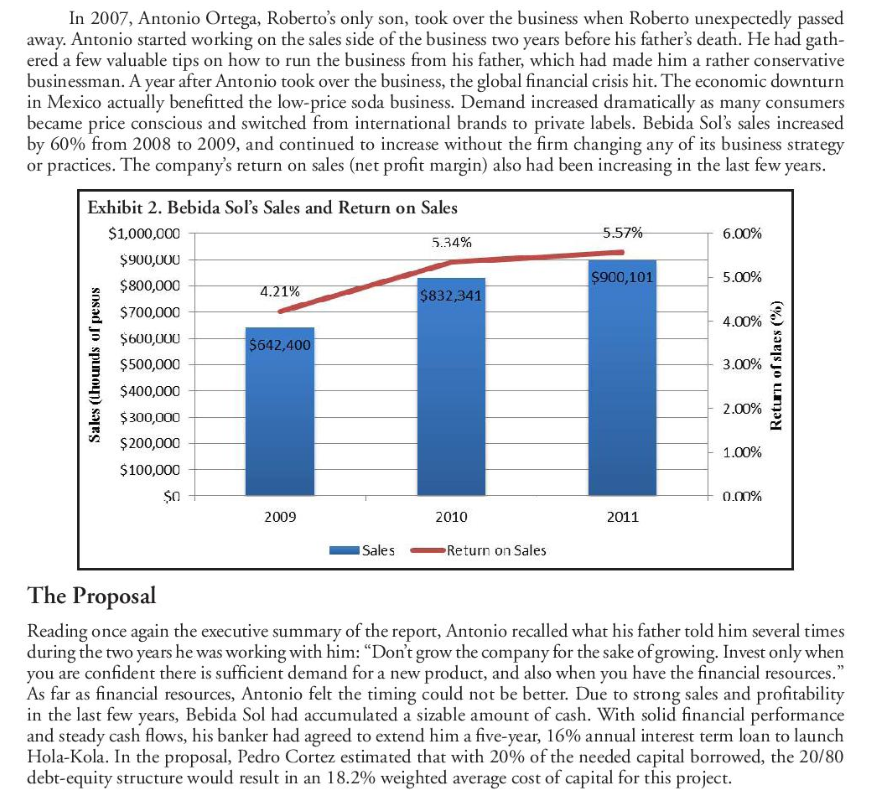
Find the NPV and should he accept this project?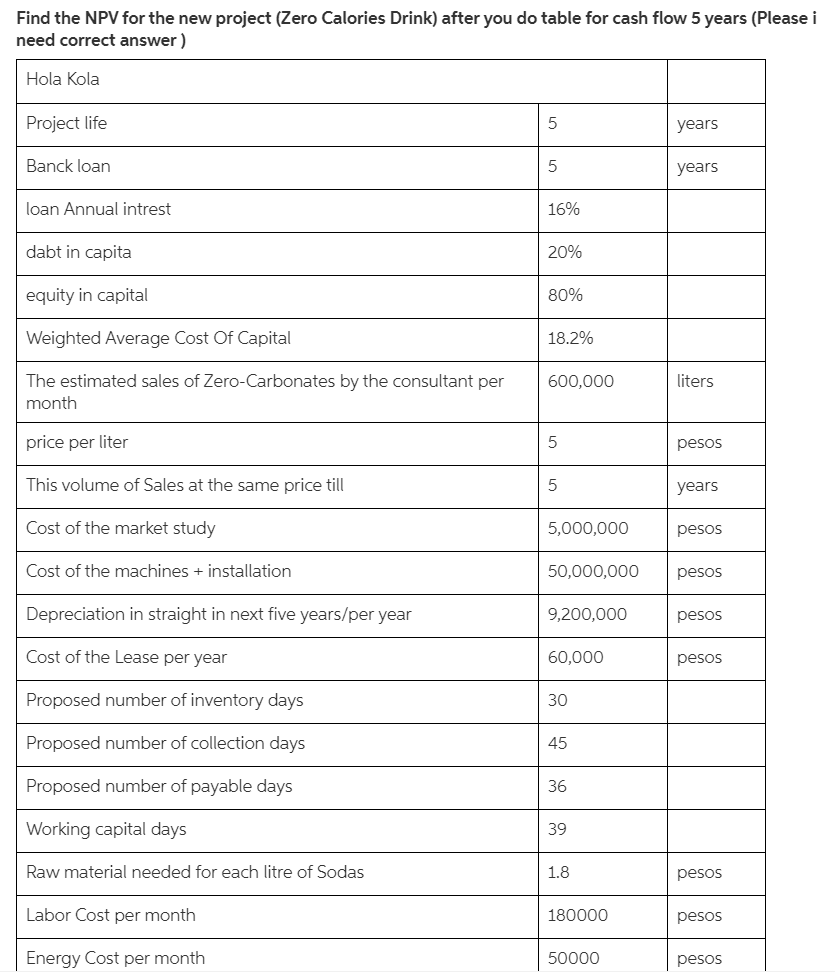
CASE
MY QUESTION:
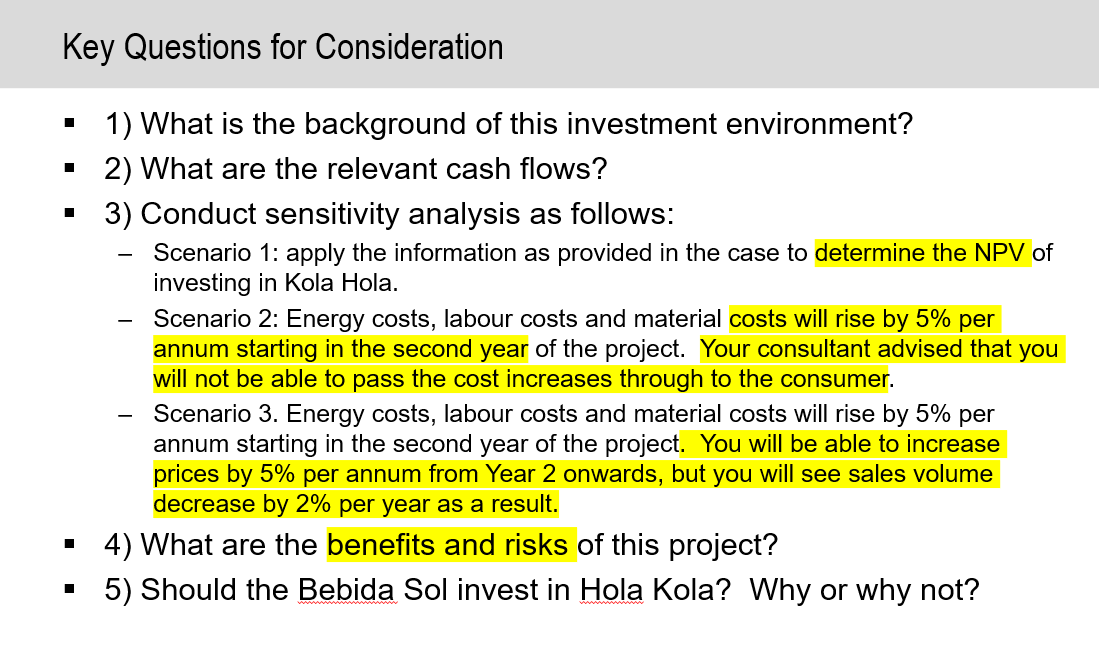
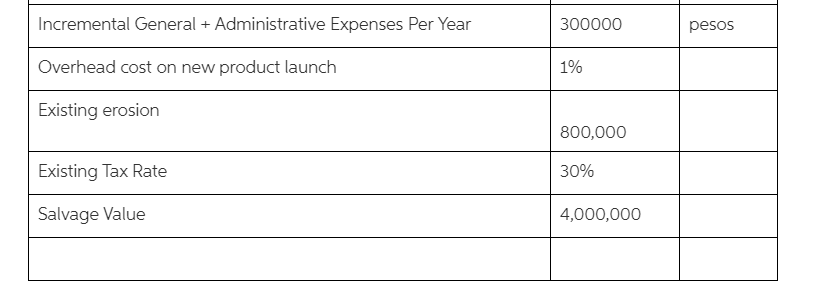
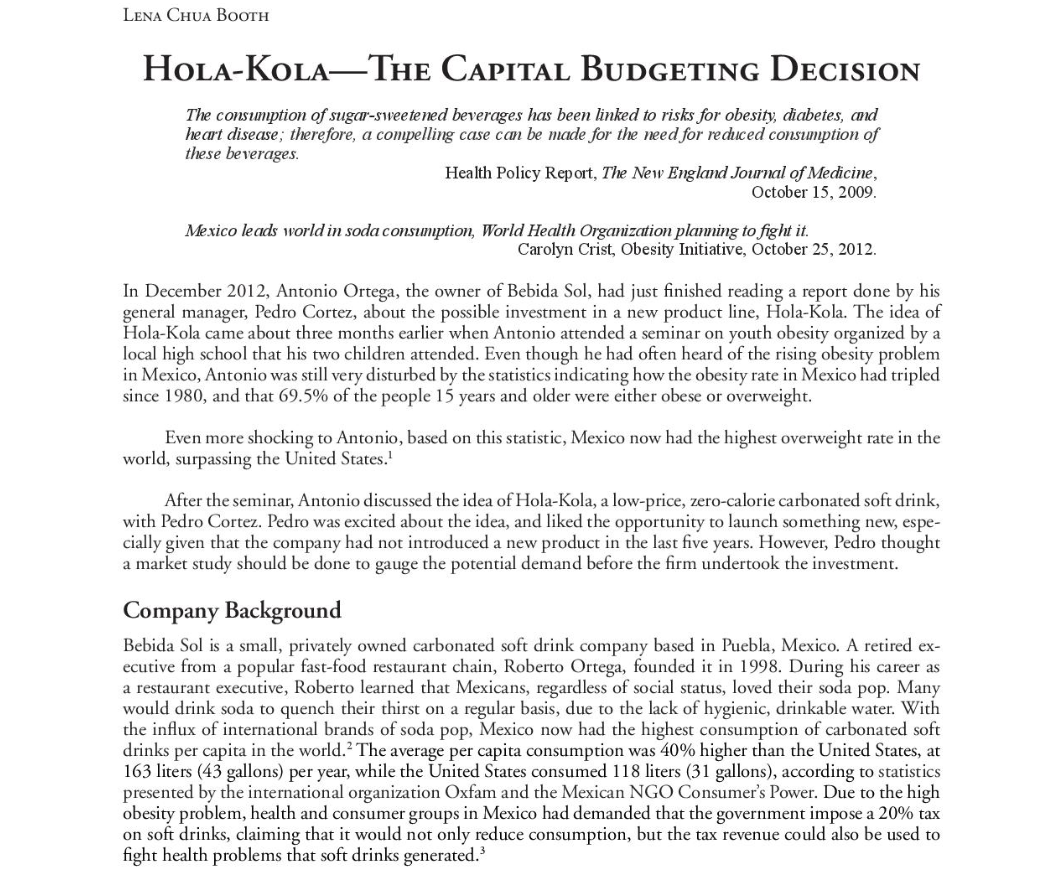
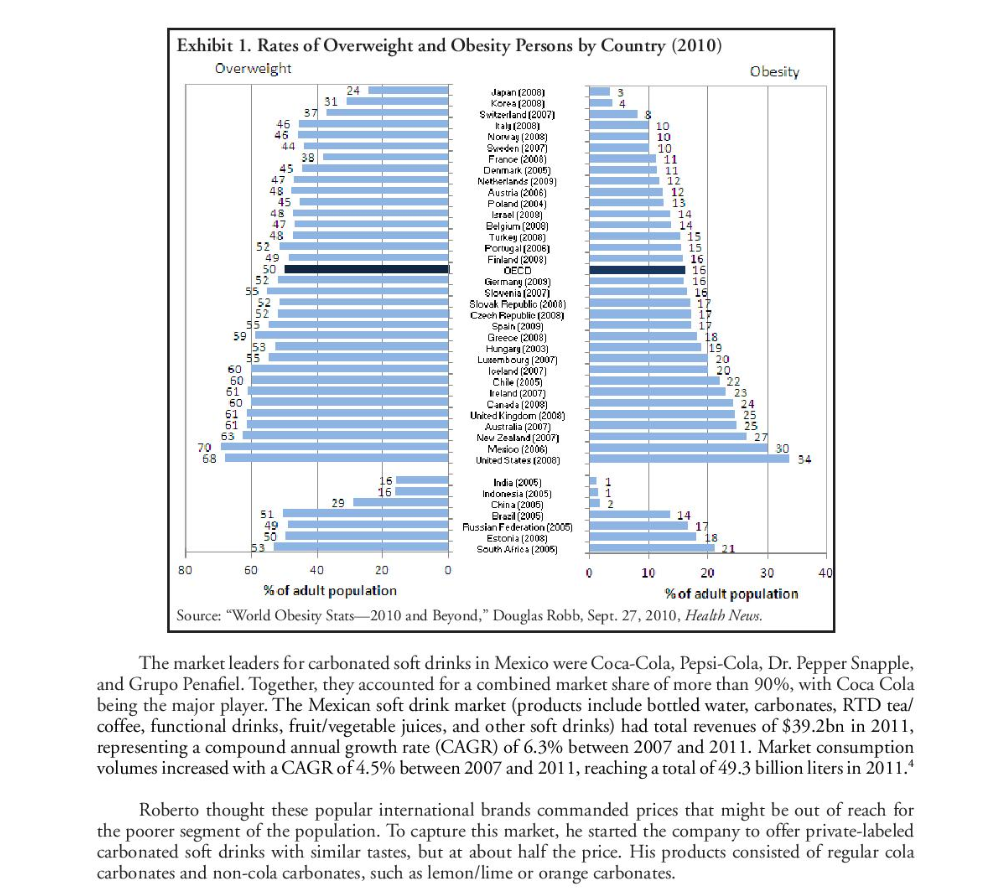
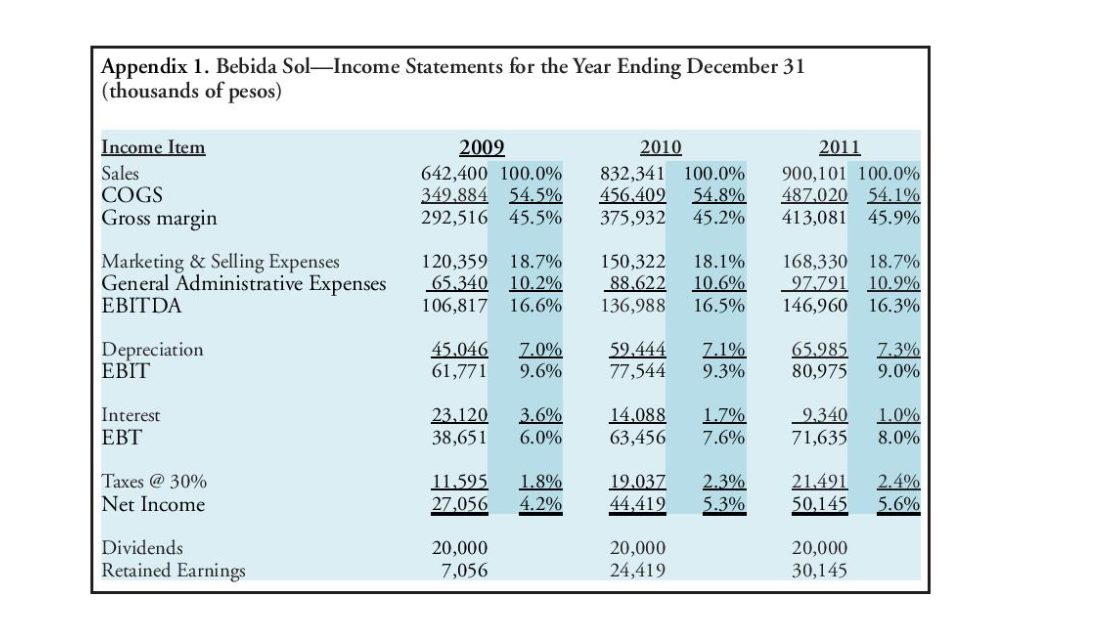
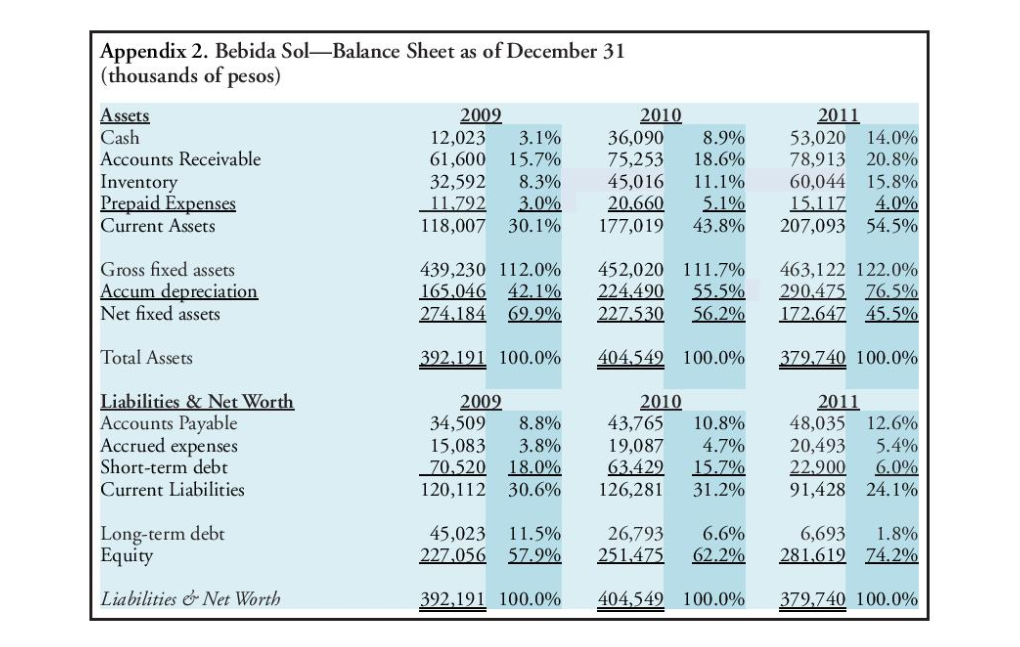
Find the NPV for the new project (Zero Calories Drink) after you do table for cash flow 5 years (Please i need correct answer ) Hola Kola Project life 5 years Banck loan 5 years loan Annual intrest 16% dabt in capita 20% equity in capital 80% Weighted Average Cost Of Capital 18.2% The estimated sales of Zero-Carbonates by the consultant per month 600,000 liters price per liter 5 pesos This volume of Sales at the same price till 5 years Cost of the market study 5,000,000 pesos Cost of the machines + installation 50,000,000 pesos Depreciation in straight in next five years/per year 9,200,000 pesos Cost of the Lease per year 60,000 pesos Proposed number of inventory days 30 Proposed number of collection days 45 Proposed number of payable days 36 Working capital days 39 Raw material needed for each litre of Sodas 1.8 pesos Labor Cost per month 180000 pesos Energy Cost per month 50000 pesos Incremental General + Administrative Expenses Per Year 300000 pesos Overhead cost on new product launch 1% Existing erosion 800,000 Existing Tax Rate 30% Salvage Value 4,000,000 LENA CHUA BOOTH HOLA-KOLATHE CAPITAL BUDGETING DECISION The consumption of sugar-sweetened beverages has been linked to risks for obesity, diabetes, and heart disease; therefore, a compelling case can be made for the need for reduced consumption of these beverages. Health Policy Report, The New England Journal of Medicine, October 15, 2009. Mexico leads world in soda consumption, World Health Organization planning to fight it. Carolyn Crist, Obesity Initiative, October 25, 2012. In December 2012, Antonio Ortega, the owner of Bebida Sol, had just finished reading a report done by his general manager, Pedro Cortez, about the possible investment in a new product line, Hola-Kola. The idea of Hola-Kola came about three months earlier when Antonio attended a seminar on youth obesity organized by a local high school that his two children attended. Even though he had often heard of the rising obesity problem in Mexico, Antonio was still very disturbed by the statistics indicating how the obesity rate in Mexico had tripled since 1980, and that 69.5% of the people 15 years and older were either obese or overweight. Even more shocking to Antonio, based on this statistic, Mexico now had the highest overweight rate in the world, surpassing the United States. After the seminar, Antonio discussed the idea of Hola-Kola, a low-price, zero-calorie carbonated soft drink, with Pedro Cortez. Pedro was excited about the idea, and liked the opportunity to launch something new, espe- cially given that the company had not introduced a new product in the last five years. However, Pedro thought a market study should be done to gauge the potential demand before the firm undertook the investment. Company Background Bebida Sol is a small, privately owned carbonated soft drink company based in Puebla, Mexico. A retired ex- ecutive from a popular fast-food restaurant chain, Roberto Ortega, founded it in 1998. During his career as a restaurant executive, Roberto learned that Mexicans, regardless of social status, loved their soda pop. Many would drink soda to quench their thirst on a regular basis, due to the lack of hygienic, drinkable water. With the influx of international brands of soda pop, Mexico now had the highest consumption of carbonated soft drinks per capita in the world. The average per capita consumption was 40% higher than the United States, at 163 liters (43 gallons) per year, while the United States consumed 118 liters (31 gallons), according to statistics presented by the international organization Oxfam and the Mexican NGO Consumer's Power. Due to the high obesity problem, health and consumer groups in Mexico had demanded that the government impose a 20% tax on soft drinks, claiming that it would not only reduce consumption, but the tax revenue could also be used to fight health problems that soft drinks generated. Exhibit 1. Rates of Overweight and Obesity Persons by Country (2010) Overweight Obesity 24 Japan (2008) 31 Korea (2008) 371 Switzerland (2007) 8 46 Italy (2008) 46 10 Norway (2008) 44 10 Sweden (20071 10 38 France (2008) 11 45 Denmark (2005) 11 47 Netherlands (2009) 12 48 Austria (2006) 45 12 Poland (2004) 13 48 Larsel (2009) 14 47 Belgium (2000) 14 48 Tuikey (2008) 15 52 Portugal (2006) 15 Finland (2008) 16 50 OECD 52 16 Germany (2009) 16 55 Slovenia [20071 16 52 Slovak Republio (2008) 52 17 Czech Republic (2008) 55 Spain (2009) 17 59 Greece (2008) 18 53 55 Hungary (2003) 19 Luembourg (2007) 20 60 Iceland (2007) 20 60 Chile (2005) 22 61 Keland (2007) 23 60 Canada (2008) 24 61 United Kingdom (2008) 25 61 Australia (2007) 25 63 New Zealand (20071 27 70 Mesico (2006) 30 68 United States (2008) 34 16 India (2005) Indonesia (2005) 29 China (2006) 51 Brazil (2005) 14 49 Russian Federation (2005) 12 50 Estonia (2008) 18 53 South Africa (2005) 80 60 40 20 0 10 20 30 % of adult population % of adult population Source: "World Obesity Stats2010 and Beyond," Douglas Robb, Sept. 27, 2010, Health News. 16 40 The market leaders for carbonated soft drinks in Mexico were Coca-Cola, Pepsi-Cola, Dr. Pepper Snapple, and Grupo Penafiel. Together, they accounted for a combined market share of more than 90%, with Coca Cola being the major player. The Mexican soft drink market (products include bottled water, carbonates, RTD teal coffee, functional drinks, fruit/vegetable juices, and other soft drinks) had total revenues of $39.2bn in 2011, representing a compound annual growth rate (CAGR) of 6.3% between 2007 and 2011. Market consumption volumes increased with a CAGR of 4.5% between 2007 and 2011, reaching a total of 49.3 billion liters in 2011. Roberto thought these popular international brands commanded prices that might be out of reach for the poorer segment of the population. To capture this market, he started the company to offer private-labeled carbonated soft drinks with similar tastes, but at about half the price. His products consisted of regular cola carbonates and non-cola carbonates, such as lemon/lime or orange carbonates. Bebida Sol's products were sold only in small, independent grocery stores and convenience stores in Mexico. The firm avoided the supermarkets and hypermarkets because it could not sustain the desired margin in these large stores. Moreover, most of the consumers, especially the middle-to-low income ones, shopped at small, independent grocery stores. To create awareness, the owners of these independent stores were given incentives to personally promote the products. Sales increased dramatically, from 80 million pesos in 1998 to about 900 million pesos in 2011. In 2007, Antonio Ortega, Roberto's only son, took over the business when Roberto unexpectedly passed away. Antonio started working on the sales side of the business two years before his father's death. He had gath- ered a few valuable tips on how to run the business from his father, which had made him a rather conservative businessman. A year after Antonio took over the business, the global financial crisis hit. The economic downturn in Mexico actually benefitted the low-price soda business. Demand increased dramatically as many consumers became price conscious and switched from international brands to private labels. Bebida Sol's sales increased by 60% from 2008 to 2009, and continued to increase without the firm changing any of its business strategy or practices. The company's return on sales (net profit margin) also had been increasing in the last few years. 5.57% 6.00% $900,101 5.00% 4.00% Sales (thounds of pesus Exhibit 2. Bebida Sol's Sales and Return on Sales $1,000,000 5.34% $900,000 $800,000 4.21% $832,341 $700,000 $600,000 $642,400 $500,000 $400,000 $300,000 $200,000 $100,000 $0 2009 2010 3.00% Return of slacs (%) 2.00% 1.00% 0.00% 2011 Sales -Return on Sales The Proposal Reading once again the executive summary of the report, Antonio recalled what his father told him several times during the two years he was working with him: Don't grow the company for the sake of growing. Invest only when you are confident there is sufficient demand for a new product, and also when you have the financial resources. As far as financial resources, Antonio felt the timing could not be better. Due to strong sales and profitability in the last few years, Bebida Sol had accumulated a sizable amount of cash. With solid financial performance and steady cash flows, his banker had agreed to extend him a five-year, 16% annual interest term loan to launch Hola-Kola. In the proposal, Pedro Cortez estimated that with 20% of the needed capital borrowed, the 20/80 debt-equity structure would result in an 18.2% weighted average cost of capital for this project. The bigger question lingering in Antonio's mind was whether there would be sufficient demand for this new, zero-calorie product line. Even though the demand for low-calorie sodas had increased in Mexico, they seemed to be consumed mainly by the middle-to-upper income segment of the population. The majority of the lower-income people still consumed only the regular, high-sugared carbonated soft drinks. It wasn't clear whether this was because the low-income group lacked the awareness of the obesity problem, or because there were not too many low-priced, low-calorie soda options available. If it were the former, the outlook for low- price, low-calorie carbonated soft drinks might not be too promising at this time. If it were the latter, it might be the perfect timing for Bebida Sol to introduce Hola-Kola. Pedro hired a consultant to do a market study right after Antonio discussed the idea of Hola-Kola with him. The consultant estimated that the company could sell a total of 600,000 liters of these zero-calorie carbonates a month, at a projected price of five pesos a liter. This volume of sales was expected for a period of five years at the same price. The market study took about two months to complete and cost the company five million pesos, which Pedro had paid shortly after its completion. Since the existing bottling plant was running at 100% capacity producing regular sodas, the proposal called for a fleet of new, semi-automated bottling and kegging machines designed for long, high-quality runs. The total cost of these machines, including installation, was estimated to be 50 million pesos. This amount could be fully depreciated on a straight-line basis over a period of five years. Pedro believed that the purchase of these machines would enable Bebida Sol to reduce its cost of labor and therefore the price to the customers, putting the firm in a more competitive position. With proper maintenance, these machines could produce at least 600,000 liters carbonated drinks per month. Pedro also estimated that these machines would have a resale value of four million pesos in five years' time, if the company were to either shut down the production of Hola-Kola, or replace these machines with fully automated ones at that time. The new machines would be housed in an unoccupied annex by the main production facility of Bebida Sol. The annex was also large enough to store the finished products before they were shipped out to grocery stores. Antonio's father built the annex years ago when he planned to venture into the mineral water business. He died before he could execute his plan. The annex had been vacant ever since, even though Antonio recently received an offer to lease out the space for 60,000 pesos a year. Pedro determined that additional working capital was needed to ensure smooth production and sales of this new product line. He proposed keeping raw materials inventory at a level equal to one month of produc- tion. To encourage the independent grocery stores to carry the new product line, he proposed offering a longer collection period, letting the grocers pay in 45 days, instead of the normal 30 days. As far as accounts payable, he would follow the company's normal policy, and settle the accounts in 36 days. The proposal also outlined the various estimates of production and overhead costs, and selling expenses. Raw materials needed to produce the sodas were estimated to be 1.8 pesos per liter, while labor costs and energy costs per month were estimated to be 180,000 pesos and 50,000 pesos, respectively. The incremental general administrative and selling expenses were quite modest, estimated to be 300,000 a year, as the new product could be sold by Bebida Sol's current sales force and via existing distribution channels. The accounting department typically charged 1% of sales as overhead costs for any new projects. Glancing back at his notes, Antonio started pondering. The market study seemed to indicate sufficient demand for the new product line. What he really feared was that the new zero-calorie carbonates might erode the sales of his existing productsthe regular sodas. The market study suggested that potential erosion could cost the firm as much as 800,000 pesos of after-tax cash flows per year. At the new tax rate of 30% for both income and capital gains, could he add value to the firm by taking on this project? Appendix 1. Bebida Sol-Income Statements for the Year Ending December 31 (thousands of pesos) 2009 642,400 100.0% 349,884 54.5% 292,516 45.5% 2010 832,341 100.0% 456,402 54.8% 375,932 45.2% Income Item Sales COGS Gross margin Marketing & Selling Expenses General Administrative Expenses EBITDA 2011 900,101 100.0% 487,020 54.1% 413,081 45.9% 120,359 65.340 106,817 18.7% 10.2% 16.6% 150,322 88,622 136,988 18.1% 10.6% 16.5% 168,330 18.7% 97.791 10.9% 146,960 16.3% Depreciation EBIT 45.046 61,771 7.0% 9.6% 59.444 77,544 7.1% 9.3% 65.985 80,975 7.3% 9.0% Interest 23,120 38,651 3.6% 6.0% 14,088 63,456 1.7% 7.6% 9.340 71,635 1.0% 8.0% Taxes @ 30% Net Income 11,595 27,056 1.8% 4.2% 19,037 44,419 2.3% 5.3% 21.491 50,145 2.4% 5.6% Dividends Retained Earnings 20,000 7,056 20,000 24,419 20,000 30,145 Appendix 2. Bebida SolBalance Sheet as of December 31 (thousands of pesos) Assets Cash Accounts Receivable Inventory Prepaid Expenses Current Assets 2002 12,023 3.1% 61,600 15.7% 32,592 8.3% 11,792 3.0% 118,007 30.1% 2010 36,090 75,253 45,016 20,660 177,019 8.9% 18.6% 11.1% 5.1% 43.8% 2011 53,020 14.0% 78,913 20.8% 60,044 15.8% 15,117 4.0% 207,093 54.5% Gross fixed assets Accum depreciation Net fixed assets 439,230 112.0% 165,046 42.1% 274,184 69.9% 452,020 111.7% 224,490 55.5% 227530 56.2% 463,122 122.0% 290,475 76.5% 172,647 45.5% Total Assets 392,191 100.0% 404.549 100.0% 379.740 100.0% Liabilities & Net Worth Accounts Payable Accrued expenses Short-term debt Current Liabilities 2009 34,509 8.8% 15,083 3.8% 70,520 18.0% 120,112 30.6% 2010 43,765 19,087 63.429 126,281 10.8% 4.7% 15.7% 31.2% 2011 48,035 12.6% 20,493 5.4% 22.900 6.0% 91,428 24.1% Long-term debt Equity 45,023 11.5% 227,056 57.9% 26,793 251.475 6.6% 62.2% 6,693 1.8% 281,619 74.2% Liabilities & Net Worth 392,191 100.0% 404,549 100.0% 379.740 100.0% Key Questions for Consideration 1 1) What is the background of this investment environment? 2) What are the relevant cash flows? 3) Conduct sensitivity analysis as follows: Scenario 1: apply the information as provided in the case to determine the NPV of investing in Kola Hola. Scenario 2: Energy costs, labour costs and material costs will rise by 5% per annum starting in the second year of the project. Your consultant advised that you will not be able to pass the cost increases through to the consumer. Scenario 3. Energy costs, labour costs and material costs will rise by 5% per annum starting in the second year of the project. You will be able to increase prices by 5% per annum from Year 2 onwards, but you will see sales volume decrease by 2% per year as a result. 4) What are the benefits and risks of this project? 5) Should the Bebida Sol invest in Hola Kola? Why or why not? Find the NPV for the new project (Zero Calories Drink) after you do table for cash flow 5 years (Please i need correct answer ) Hola Kola Project life 5 years Banck loan 5 years loan Annual intrest 16% dabt in capita 20% equity in capital 80% Weighted Average Cost Of Capital 18.2% The estimated sales of Zero-Carbonates by the consultant per month 600,000 liters price per liter 5 pesos This volume of Sales at the same price till 5 years Cost of the market study 5,000,000 pesos Cost of the machines + installation 50,000,000 pesos Depreciation in straight in next five years/per year 9,200,000 pesos Cost of the Lease per year 60,000 pesos Proposed number of inventory days 30 Proposed number of collection days 45 Proposed number of payable days 36 Working capital days 39 Raw material needed for each litre of Sodas 1.8 pesos Labor Cost per month 180000 pesos Energy Cost per month 50000 pesos Incremental General + Administrative Expenses Per Year 300000 pesos Overhead cost on new product launch 1% Existing erosion 800,000 Existing Tax Rate 30% Salvage Value 4,000,000 LENA CHUA BOOTH HOLA-KOLATHE CAPITAL BUDGETING DECISION The consumption of sugar-sweetened beverages has been linked to risks for obesity, diabetes, and heart disease; therefore, a compelling case can be made for the need for reduced consumption of these beverages. Health Policy Report, The New England Journal of Medicine, October 15, 2009. Mexico leads world in soda consumption, World Health Organization planning to fight it. Carolyn Crist, Obesity Initiative, October 25, 2012. In December 2012, Antonio Ortega, the owner of Bebida Sol, had just finished reading a report done by his general manager, Pedro Cortez, about the possible investment in a new product line, Hola-Kola. The idea of Hola-Kola came about three months earlier when Antonio attended a seminar on youth obesity organized by a local high school that his two children attended. Even though he had often heard of the rising obesity problem in Mexico, Antonio was still very disturbed by the statistics indicating how the obesity rate in Mexico had tripled since 1980, and that 69.5% of the people 15 years and older were either obese or overweight. Even more shocking to Antonio, based on this statistic, Mexico now had the highest overweight rate in the world, surpassing the United States. After the seminar, Antonio discussed the idea of Hola-Kola, a low-price, zero-calorie carbonated soft drink, with Pedro Cortez. Pedro was excited about the idea, and liked the opportunity to launch something new, espe- cially given that the company had not introduced a new product in the last five years. However, Pedro thought a market study should be done to gauge the potential demand before the firm undertook the investment. Company Background Bebida Sol is a small, privately owned carbonated soft drink company based in Puebla, Mexico. A retired ex- ecutive from a popular fast-food restaurant chain, Roberto Ortega, founded it in 1998. During his career as a restaurant executive, Roberto learned that Mexicans, regardless of social status, loved their soda pop. Many would drink soda to quench their thirst on a regular basis, due to the lack of hygienic, drinkable water. With the influx of international brands of soda pop, Mexico now had the highest consumption of carbonated soft drinks per capita in the world. The average per capita consumption was 40% higher than the United States, at 163 liters (43 gallons) per year, while the United States consumed 118 liters (31 gallons), according to statistics presented by the international organization Oxfam and the Mexican NGO Consumer's Power. Due to the high obesity problem, health and consumer groups in Mexico had demanded that the government impose a 20% tax on soft drinks, claiming that it would not only reduce consumption, but the tax revenue could also be used to fight health problems that soft drinks generated. Exhibit 1. Rates of Overweight and Obesity Persons by Country (2010) Overweight Obesity 24 Japan (2008) 31 Korea (2008) 371 Switzerland (2007) 8 46 Italy (2008) 46 10 Norway (2008) 44 10 Sweden (20071 10 38 France (2008) 11 45 Denmark (2005) 11 47 Netherlands (2009) 12 48 Austria (2006) 45 12 Poland (2004) 13 48 Larsel (2009) 14 47 Belgium (2000) 14 48 Tuikey (2008) 15 52 Portugal (2006) 15 Finland (2008) 16 50 OECD 52 16 Germany (2009) 16 55 Slovenia [20071 16 52 Slovak Republio (2008) 52 17 Czech Republic (2008) 55 Spain (2009) 17 59 Greece (2008) 18 53 55 Hungary (2003) 19 Luembourg (2007) 20 60 Iceland (2007) 20 60 Chile (2005) 22 61 Keland (2007) 23 60 Canada (2008) 24 61 United Kingdom (2008) 25 61 Australia (2007) 25 63 New Zealand (20071 27 70 Mesico (2006) 30 68 United States (2008) 34 16 India (2005) Indonesia (2005) 29 China (2006) 51 Brazil (2005) 14 49 Russian Federation (2005) 12 50 Estonia (2008) 18 53 South Africa (2005) 80 60 40 20 0 10 20 30 % of adult population % of adult population Source: "World Obesity Stats2010 and Beyond," Douglas Robb, Sept. 27, 2010, Health News. 16 40 The market leaders for carbonated soft drinks in Mexico were Coca-Cola, Pepsi-Cola, Dr. Pepper Snapple, and Grupo Penafiel. Together, they accounted for a combined market share of more than 90%, with Coca Cola being the major player. The Mexican soft drink market (products include bottled water, carbonates, RTD teal coffee, functional drinks, fruit/vegetable juices, and other soft drinks) had total revenues of $39.2bn in 2011, representing a compound annual growth rate (CAGR) of 6.3% between 2007 and 2011. Market consumption volumes increased with a CAGR of 4.5% between 2007 and 2011, reaching a total of 49.3 billion liters in 2011. Roberto thought these popular international brands commanded prices that might be out of reach for the poorer segment of the population. To capture this market, he started the company to offer private-labeled carbonated soft drinks with similar tastes, but at about half the price. His products consisted of regular cola carbonates and non-cola carbonates, such as lemon/lime or orange carbonates. Bebida Sol's products were sold only in small, independent grocery stores and convenience stores in Mexico. The firm avoided the supermarkets and hypermarkets because it could not sustain the desired margin in these large stores. Moreover, most of the consumers, especially the middle-to-low income ones, shopped at small, independent grocery stores. To create awareness, the owners of these independent stores were given incentives to personally promote the products. Sales increased dramatically, from 80 million pesos in 1998 to about 900 million pesos in 2011. In 2007, Antonio Ortega, Roberto's only son, took over the business when Roberto unexpectedly passed away. Antonio started working on the sales side of the business two years before his father's death. He had gath- ered a few valuable tips on how to run the business from his father, which had made him a rather conservative businessman. A year after Antonio took over the business, the global financial crisis hit. The economic downturn in Mexico actually benefitted the low-price soda business. Demand increased dramatically as many consumers became price conscious and switched from international brands to private labels. Bebida Sol's sales increased by 60% from 2008 to 2009, and continued to increase without the firm changing any of its business strategy or practices. The company's return on sales (net profit margin) also had been increasing in the last few years. 5.57% 6.00% $900,101 5.00% 4.00% Sales (thounds of pesus Exhibit 2. Bebida Sol's Sales and Return on Sales $1,000,000 5.34% $900,000 $800,000 4.21% $832,341 $700,000 $600,000 $642,400 $500,000 $400,000 $300,000 $200,000 $100,000 $0 2009 2010 3.00% Return of slacs (%) 2.00% 1.00% 0.00% 2011 Sales -Return on Sales The Proposal Reading once again the executive summary of the report, Antonio recalled what his father told him several times during the two years he was working with him: Don't grow the company for the sake of growing. Invest only when you are confident there is sufficient demand for a new product, and also when you have the financial resources. As far as financial resources, Antonio felt the timing could not be better. Due to strong sales and profitability in the last few years, Bebida Sol had accumulated a sizable amount of cash. With solid financial performance and steady cash flows, his banker had agreed to extend him a five-year, 16% annual interest term loan to launch Hola-Kola. In the proposal, Pedro Cortez estimated that with 20% of the needed capital borrowed, the 20/80 debt-equity structure would result in an 18.2% weighted average cost of capital for this project. The bigger question lingering in Antonio's mind was whether there would be sufficient demand for this new, zero-calorie product line. Even though the demand for low-calorie sodas had increased in Mexico, they seemed to be consumed mainly by the middle-to-upper income segment of the population. The majority of the lower-income people still consumed only the regular, high-sugared carbonated soft drinks. It wasn't clear whether this was because the low-income group lacked the awareness of the obesity problem, or because there were not too many low-priced, low-calorie soda options available. If it were the former, the outlook for low- price, low-calorie carbonated soft drinks might not be too promising at this time. If it were the latter, it might be the perfect timing for Bebida Sol to introduce Hola-Kola. Pedro hired a consultant to do a market study right after Antonio discussed the idea of Hola-Kola with him. The consultant estimated that the company could sell a total of 600,000 liters of these zero-calorie carbonates a month, at a projected price of five pesos a liter. This volume of sales was expected for a period of five years at the same price. The market study took about two months to complete and cost the company five million pesos, which Pedro had paid shortly after its completion. Since the existing bottling plant was running at 100% capacity producing regular sodas, the proposal called for a fleet of new, semi-automated bottling and kegging machines designed for long, high-quality runs. The total cost of these machines, including installation, was estimated to be 50 million pesos. This amount could be fully depreciated on a straight-line basis over a period of five years. Pedro believed that the purchase of these machines would enable Bebida Sol to reduce its cost of labor and therefore the price to the customers, putting the firm in a more competitive position. With proper maintenance, these machines could produce at least 600,000 liters carbonated drinks per month. Pedro also estimated that these machines would have a resale value of four million pesos in five years' time, if the company were to either shut down the production of Hola-Kola, or replace these machines with fully automated ones at that time. The new machines would be housed in an unoccupied annex by the main production facility of Bebida Sol. The annex was also large enough to store the finished products before they were shipped out to grocery stores. Antonio's father built the annex years ago when he planned to venture into the mineral water business. He died before he could execute his plan. The annex had been vacant ever since, even though Antonio recently received an offer to lease out the space for 60,000 pesos a year. Pedro determined that additional working capital was needed to ensure smooth production and sales of this new product line. He proposed keeping raw materials inventory at a level equal to one month of produc- tion. To encourage the independent grocery stores to carry the new product line, he proposed offering a longer collection period, letting the grocers pay in 45 days, instead of the normal 30 days. As far as accounts payable, he would follow the company's normal policy, and settle the accounts in 36 days. The proposal also outlined the various estimates of production and overhead costs, and selling expenses. Raw materials needed to produce the sodas were estimated to be 1.8 pesos per liter, while labor costs and energy costs per month were estimated to be 180,000 pesos and 50,000 pesos, respectively. The incremental general administrative and selling expenses were quite modest, estimated to be 300,000 a year, as the new product could be sold by Bebida Sol's current sales force and via existing distribution channels. The accounting department typically charged 1% of sales as overhead costs for any new projects. Glancing back at his notes, Antonio started pondering. The market study seemed to indicate sufficient demand for the new product line. What he really feared was that the new zero-calorie carbonates might erode the sales of his existing productsthe regular sodas. The market study suggested that potential erosion could cost the firm as much as 800,000 pesos of after-tax cash flows per year. At the new tax rate of 30% for both income and capital gains, could he add value to the firm by taking on this project? Appendix 1. Bebida Sol-Income Statements for the Year Ending December 31 (thousands of pesos) 2009 642,400 100.0% 349,884 54.5% 292,516 45.5% 2010 832,341 100.0% 456,402 54.8% 375,932 45.2% Income Item Sales COGS Gross margin Marketing & Selling Expenses General Administrative Expenses EBITDA 2011 900,101 100.0% 487,020 54.1% 413,081 45.9% 120,359 65.340 106,817 18.7% 10.2% 16.6% 150,322 88,622 136,988 18.1% 10.6% 16.5% 168,330 18.7% 97.791 10.9% 146,960 16.3% Depreciation EBIT 45.046 61,771 7.0% 9.6% 59.444 77,544 7.1% 9.3% 65.985 80,975 7.3% 9.0% Interest 23,120 38,651 3.6% 6.0% 14,088 63,456 1.7% 7.6% 9.340 71,635 1.0% 8.0% Taxes @ 30% Net Income 11,595 27,056 1.8% 4.2% 19,037 44,419 2.3% 5.3% 21.491 50,145 2.4% 5.6% Dividends Retained Earnings 20,000 7,056 20,000 24,419 20,000 30,145 Appendix 2. Bebida SolBalance Sheet as of December 31 (thousands of pesos) Assets Cash Accounts Receivable Inventory Prepaid Expenses Current Assets 2002 12,023 3.1% 61,600 15.7% 32,592 8.3% 11,792 3.0% 118,007 30.1% 2010 36,090 75,253 45,016 20,660 177,019 8.9% 18.6% 11.1% 5.1% 43.8% 2011 53,020 14.0% 78,913 20.8% 60,044 15.8% 15,117 4.0% 207,093 54.5% Gross fixed assets Accum depreciation Net fixed assets 439,230 112.0% 165,046 42.1% 274,184 69.9% 452,020 111.7% 224,490 55.5% 227530 56.2% 463,122 122.0% 290,475 76.5% 172,647 45.5% Total Assets 392,191 100.0% 404.549 100.0% 379.740 100.0% Liabilities & Net Worth Accounts Payable Accrued expenses Short-term debt Current Liabilities 2009 34,509 8.8% 15,083 3.8% 70,520 18.0% 120,112 30.6% 2010 43,765 19,087 63.429 126,281 10.8% 4.7% 15.7% 31.2% 2011 48,035 12.6% 20,493 5.4% 22.900 6.0% 91,428 24.1% Long-term debt Equity 45,023 11.5% 227,056 57.9% 26,793 251.475 6.6% 62.2% 6,693 1.8% 281,619 74.2% Liabilities & Net Worth 392,191 100.0% 404,549 100.0% 379.740 100.0% Key Questions for Consideration 1 1) What is the background of this investment environment? 2) What are the relevant cash flows? 3) Conduct sensitivity analysis as follows: Scenario 1: apply the information as provided in the case to determine the NPV of investing in Kola Hola. Scenario 2: Energy costs, labour costs and material costs will rise by 5% per annum starting in the second year of the project. Your consultant advised that you will not be able to pass the cost increases through to the consumer. Scenario 3. Energy costs, labour costs and material costs will rise by 5% per annum starting in the second year of the project. You will be able to increase prices by 5% per annum from Year 2 onwards, but you will see sales volume decrease by 2% per year as a result. 4) What are the benefits and risks of this project? 5) Should the Bebida Sol invest in Hola Kola? Why or why not