Find the range for the given data. Fred, a local mechanic, gathered the following data regarding the price, in dollars, of an oil and filter
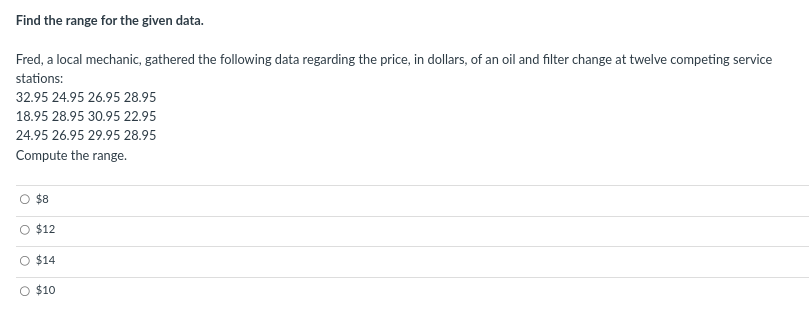
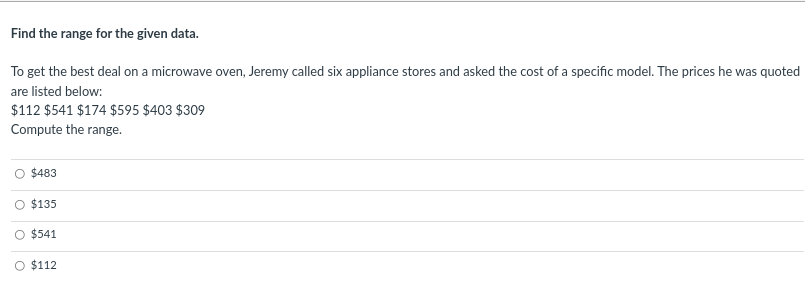
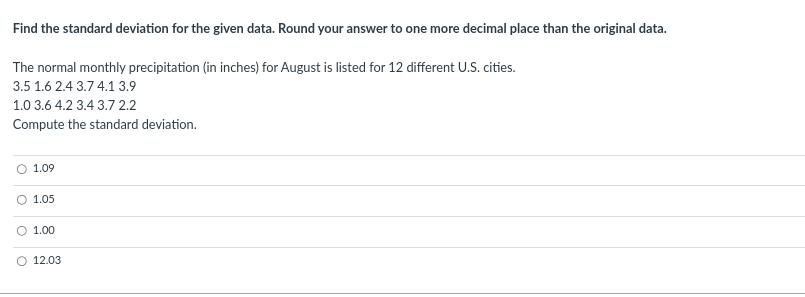
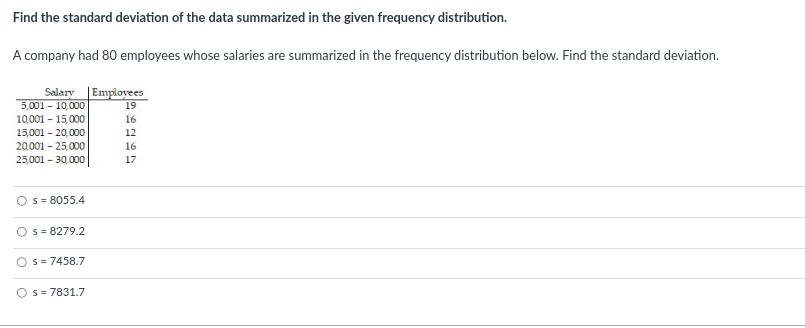
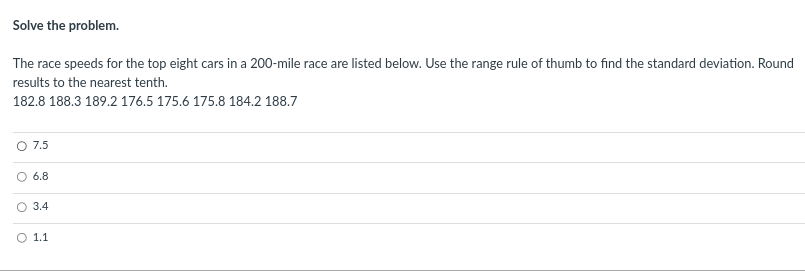
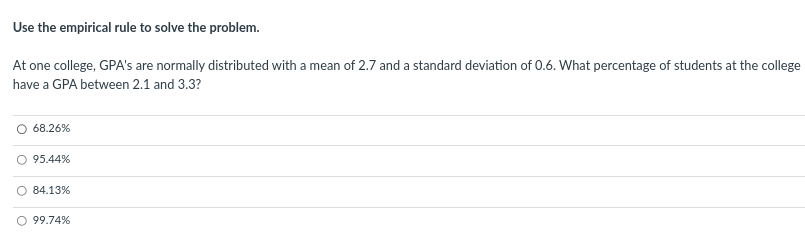
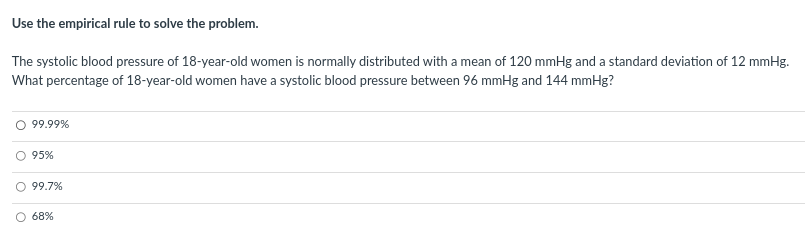
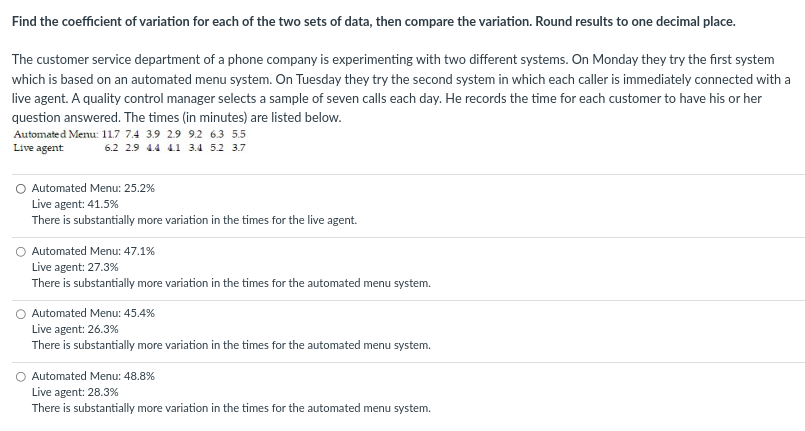
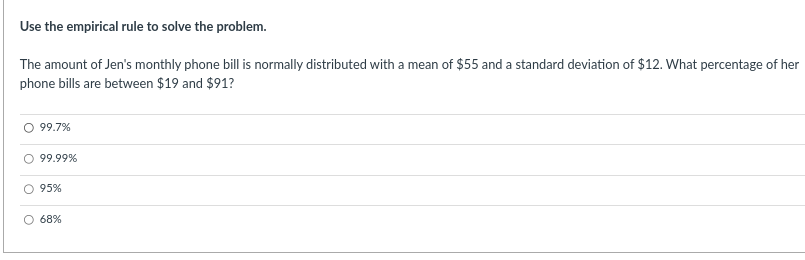
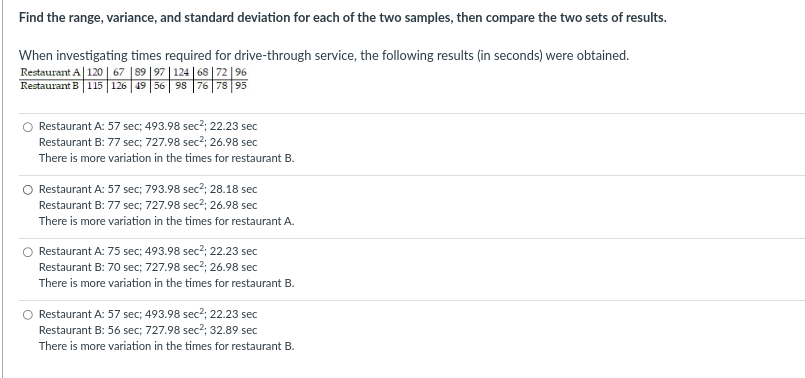
Find the range for the given data. Fred, a local mechanic, gathered the following data regarding the price, in dollars, of an oil and filter change at twelve competing service stations: 32.95 24.95 26.95 28.95 18.95 28.95 30.95 22.95 24.95 26.95 29.95 28.95 Compute the range. O $8 O $12 O $14 O $10Find the range for the given data. To get the best deal on a microwave oven. Jeremy called six appliance stores and asked the cost of a specic model. The prices he was quoted are listed below: $112 $541 $1?4 $595 $403 $30? Compute the range. 0 $433 Q $135 0 $541 0 $112 Find the standard deviation for the given data. Round 1,I'our answer to one more decimal place than the original data. The normal monthly:r precipitation {in inches] tor August is listed for 12 different U.S. cities. 3.5 1.6 2.4 3.? 4.1 3.9 1.0 3.6 4.2 3.4 3.? 2.2 Compute the standard deviation. 0 1.09 O 1.05 Q 1.00 C;- 12.03 Find the standard deviation of the data summarized in the given frequency distribution. A company had 80 employees whose salaries are summarized in the frequency distribution below. Find the standard deviation. Salary Employees 5,001 - 10,000 19 10,001 - 15,000 16 15,001 - 20,000 12 20,001 - 25,000 16 25,001 - 30,000 17 O s = 8055.4 O s = 8279.2 O s = 7458.7 O s = 7831.7Solve the problem. The race speeds for the top eight cars in a 200-mile race are listed below. Use the range rule of thumb to find the standard deviation. Round results to the nearest tenth. 182.8 188.3 189.2 176.5 175.6 175.8 184.2 188.7 0 7.5 O 6.8 O 3.4 O 1.1Use the empirical rule to solve the problem. At one college, GPA's are normally distributed with a mean of 2.7 and a standard deviation of 0.6. What percentage of students at the college have a GPA between 2.1 and 3.3? O 68.26% O 95.44% O 84.13% O 99.74%Use the empirical rule to solve the problem. The systolic blood pressure of 18-year-old women is normally distributed with a mean of 120 mmHg and a standard deviation of 12 mmHg. What percentage of 18-year-old women have a systolic blood pressure between 96 mmHg and 144 mmg? O 99.99% 0 95% O 99.7% O 68%Find the coefficient of variation for each of the two sets of data, then compare the variation. Round results to one decimal place. The customer service department of a phone company is experimenting with two different systems. On Monday they try the first system which is based on an automated menu system. On Tuesday they try the second system in which each caller is immediately connected with a live agent. A quality control manager selects a sample of seven calls each day. He records the time for each customer to have his or her question answered. The times (in minutes) are listed below. Automated Menu: 117 7.4 3.9 2.9 9.2 63 5.5 Live agent 6.2 2.9 4.4 41 3.4 5.2 3.7 O Automated Menu: 25.2% Live agent: 41.5% There is substantially more variation in the times for the live agent. O Automated Menu: 47.1% Live agent: 27.3% There is substantially more variation in the times for the automated menu system. O Automated Menu: 45.4% Live agent: 26.3% There is substantially more variation in the times for the automated menu system. O Automated Menu: 48.8% Live agent: 28.3% There is substantially more variation in the times for the automated menu system.Use the empirical rule to solve the problem. The amount of Jen's monthly phone bill is normally.r distributed with a mean of $55 and a standard deviation of $12. What percentage of her phone bills are between $19 and $91? 0 99_?% C: 99.99% 95% D C 68% Find the range, variance, and standard deviation for each of the two samples, then compare the two sets of results. When investigating times required for drive-through service, the following results (in seconds) were obtained. Restaurant A | 120 | 67 89 97 | 124 | 68 | 72 |96 Restaurant B 115 126 19 56 98 76 78 95 O Restaurant A: 57 sec; 493.98 sec?; 22.23 sec Restaurant B: 77 sec; 727.98 sec?; 26.98 sec There is more variation in the times for restaurant B. O Restaurant A: 57 sec; 793.98 sec ; 28.18 sec Restaurant B: 77 sec; 727.98 sec?; 26.98 sec There is more variation in the times for restaurant A. O Restaurant A: 75 sec; 493.98 sec ; 22.23 sec Restaurant B: 70 sec; 727.98 sec2; 26.98 sec There is more variation in the times for restaurant B. O Restaurant A: 57 sec; 493.98 sec?; 22.23 sec Restaurant B: 56 sec; 727.98 sec?; 32.89 sec There is more variation in the times for restaurant B
Step by Step Solution
There are 3 Steps involved in it
Step: 1
Get Instant Access to Expert-Tailored Solutions
See step-by-step solutions with expert insights and AI powered tools for academic success
Step: 2
Step: 3
Ace Your Homework with AI
Get the answers you need in no time with our AI-driven, step-by-step assistance