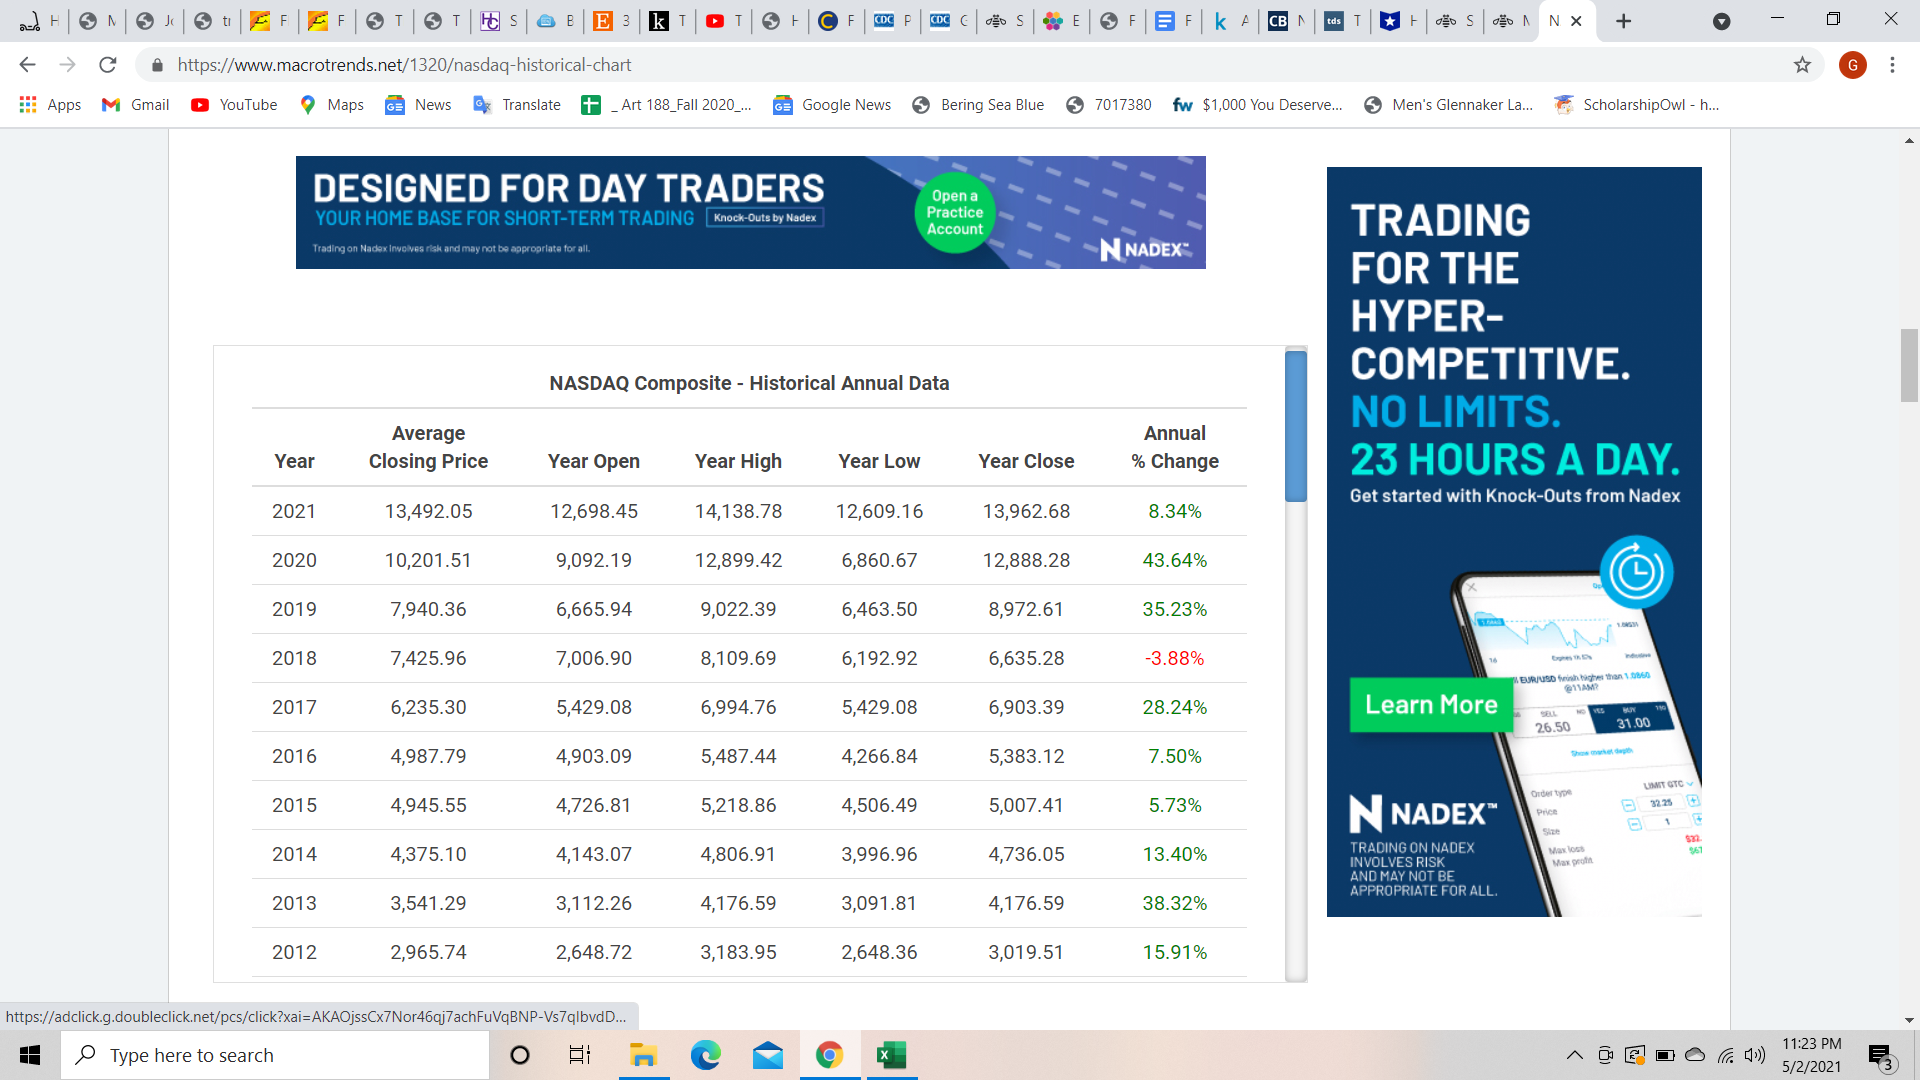
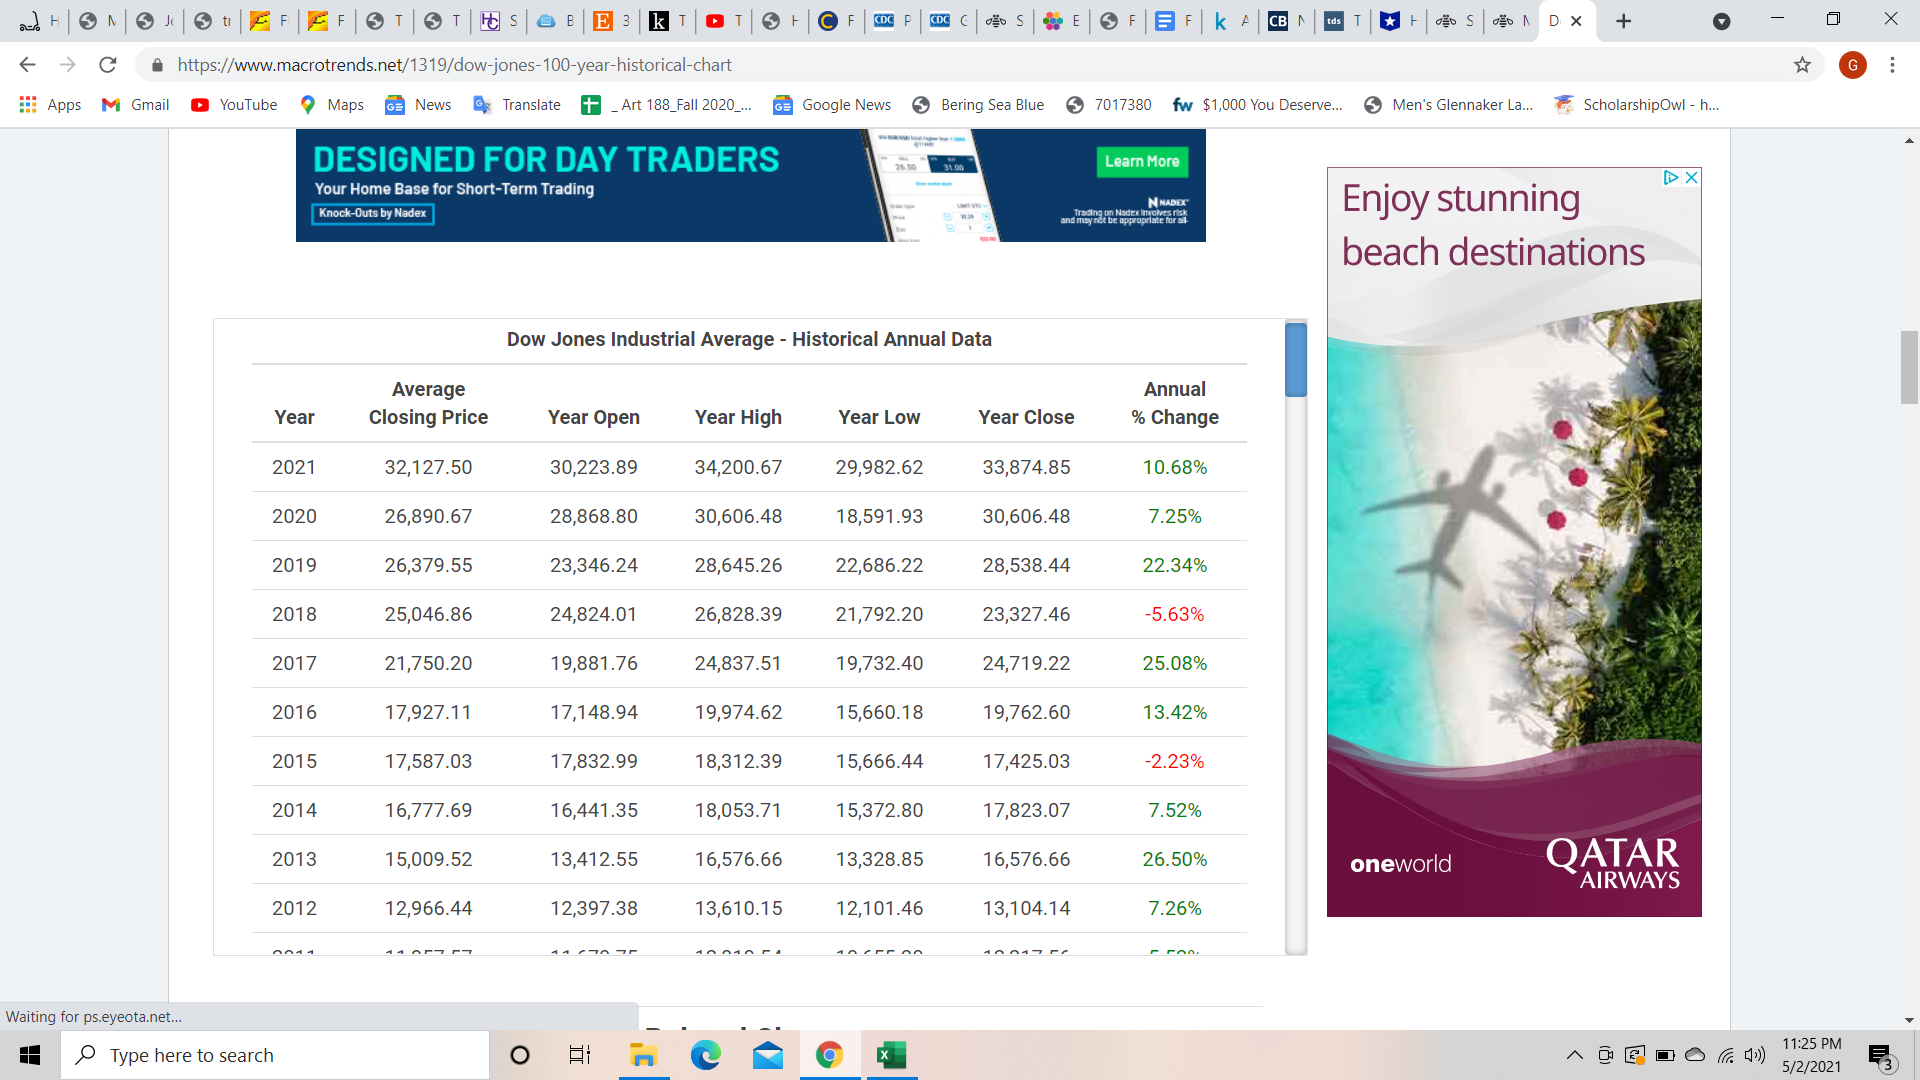
Find the summary measurements: min, max, mean, median, standard deviation of the historical prices of 2 stocks. b. Draw a Box Plot (Q1, Q2 and Q3) for both data that we picked.
a d H | E N| 3 1| + E F E F | T S T ES Q B E 3 K T Q & F C F CDC F CDC C D S E F E F K A CBN ids T *+ 0 5 0O A N X + X C A https://www.macrotrends.net/1320asdaq-historical-chart G Apps M Gmail YouTube 9 Maps = News Translate + _ Art 188_Fall 2020_... = Google News Bering Sea Blue 5 7017380 fw $1,000 You Deserve... Men's Glennaker La. ScholarshipOwl - h.. DESIGNED FOR DAY TRADERS Open a YOUR HOME BASE FOR SHORT-TERM TRADING Knock-Outs by Nadex Practice Account TRADING Trading on Nadex Involves risk and may not be ap NNADEX FOR THE HYPER- COMPETITIVE. NASDAQ Composite - Historical Annual Data NO LIMITS. Average Annual Year Closing Price Year Open Year High Year Low Year Close % Change 23 HOURS A DAY. Get started with Knock-Outs from Nadex 2021 13,492.05 12,698.45 14,138.78 12,609.16 13,962.68 8.34% 2020 10,201.51 9,092.19 12,899.42 6,860.67 12,888.28 43.64% 2019 7,940.36 6,665.94 9,022.39 6,463.50 8,972.61 35.23% 2018 7,425.96 7,006.90 8,109.69 6,192.92 6,635.28 -3.88% EUR/USD frish higher than 1 0860 2017 6,235.30 5,429.08 6,994.76 5,429.08 6,903.39 28.24% Learn More SELL 26.50 31.00 2016 4,987.79 4,903.09 5,487.44 4,266.84 5,383.12 7.50% LIMIT GTC 2015 4,945.55 4,726.81 5,218.86 4,506.49 5,007.41 5.73% N NADEX Order type Price 32.25+ Size 2014 4,375.10 4,143.07 4,806.91 3,996.96 4,736.05 13.40% TRADING ON NADEX Max loss INVOLVES RISK Max profe AND MAY NOT BE APPROPRIATE FOR ALL. 2013 3,541.29 3,112.26 4,176.59 3,091.81 4,176.59 38.32% 2012 2,965.74 2,648.72 3,183.95 2,648.36 3,019.51 15.91% https://adclick.g.doubleclick.net/pcs/click?xai=AKAOjssCx7Nor46qj7achFuVqBNP-Vs7qlbvdD... Type here to search O 11:23 PM 5/2/2021ad H E N| 3 1 3 + E F E F | T S T CS O B E 3 K T Q & F C F CDC P CDC CO S E OF E F K A CBN Reds T *+ 40 5 ON DX + X C A https://www.macrotrends.net/1319/dow-jones-100-year-historical-chart G Apps M Gmail YouTube Maps = News Translate + _ Art 188_Fall 2020_... GE Google News Bering Sea Blue 7017380 fw $1,000 You Deserve... Men's Glennaker La.. ScholarshipOwl - h... DESIGNED FOR DAY TRADERS 26.50 31 90 Learn More DX Your Home Base for Short-Term Trading N MADEX" Knock-Outs by Nadex Enjoy stunning beach destinations Dow Jones Industrial Average - Historical Annual Data Average Annual Year Closing Price Year Open Year High Year Low Year Close % Change 2021 32,127.50 30,223.89 34,200.67 29,982.62 33,874.85 10.68% 2020 26,890.67 28,868.80 30,606.48 18,591.93 30,606.48 7.25% 2019 26,379.55 23,346.24 28,645.26 22,686.22 28,538.44 22.34% 2018 25,046.86 24,824.01 26,828.39 21,792.20 23,327.46 -5.63% 2017 21,750.20 19,881.76 24,837.51 19,732.40 24,719.22 25.08% 2016 17,927.11 17,148.94 19,974.62 15,660.18 19,762.60 13.42% 2015 17,587.03 17,832.99 18,312.39 15,666.44 17,425.03 -2.23% 2014 16,777.69 16,441.35 18,053.71 15,372.80 17,823.07 7.52% 2013 15,009.52 13,412.55 16,576.66 13,328.85 16,576.66 26.50% oneworld QATAR AIRWAYS 2012 12,966.44 12,397.38 13,610.15 12,101.46 13, 104.14 7.26% 4 Am m- Waiting for ps.eyeota.net.. Type here to search O 11:25 PM 5/2/2021


