

Answered step by step
Verified Expert Solution
Question
1 Approved Answer
Find the test statistic and p-value using the data. 10 12 13 14 15 16 17 18 19 20 21 Florida 13 12 17 17
Find the test statistic and p-value using the data.
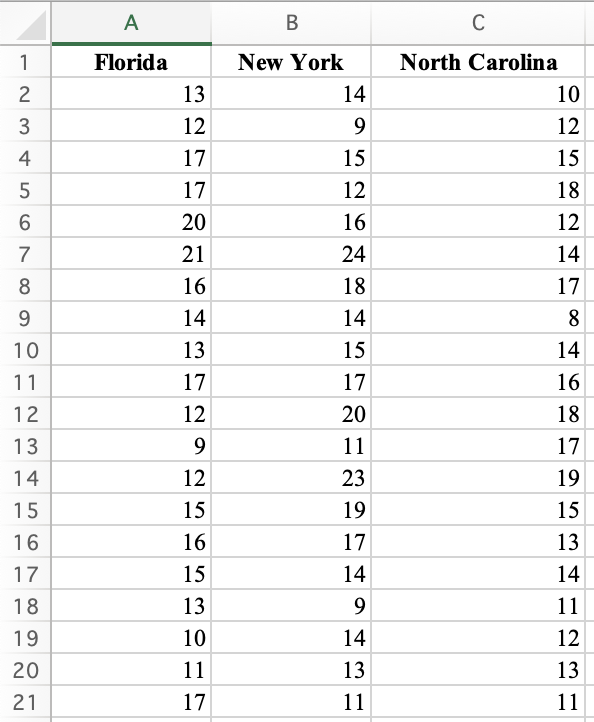
10 12 13 14 15 16 17 18 19 20 21 Florida 13 12 17 17 20 21 16 14 13 17 12 12 15 16 15 13 10 11 17 New York 14 15 12 16 24 18 14 15 17 20 11 23 19 17 14 14 13 11 North Carolina 10 12 15 18 12 14 17 14 16 18 17 19 15 13 14 11 12 13 11
Step by Step Solution
There are 3 Steps involved in it
Step: 1

Get Instant Access to Expert-Tailored Solutions
See step-by-step solutions with expert insights and AI powered tools for academic success
Step: 2

Step: 3
Ace Your Homework with AI
Get the answers you need in no time with our AI-driven, step-by-step assistance
Get Started
Prealgebra & Algebra (subscription)
Authors: Elayn Martin Gay
5th Edition
0134708601, 9780134708607