

Answered step by step
Verified Expert Solution
Question
1 Approved Answer
finish project3.1 only , all the information is above Project 1.2. Bobcats Most species of wild cats are endangered including the bobcat. This project explores
finish project3.1 only , all the information is above
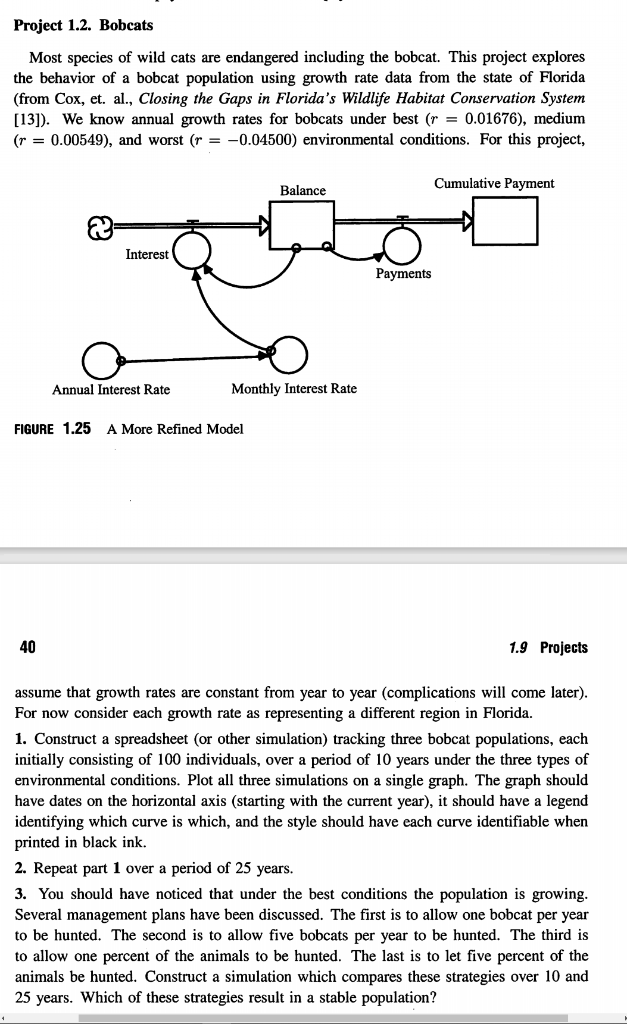
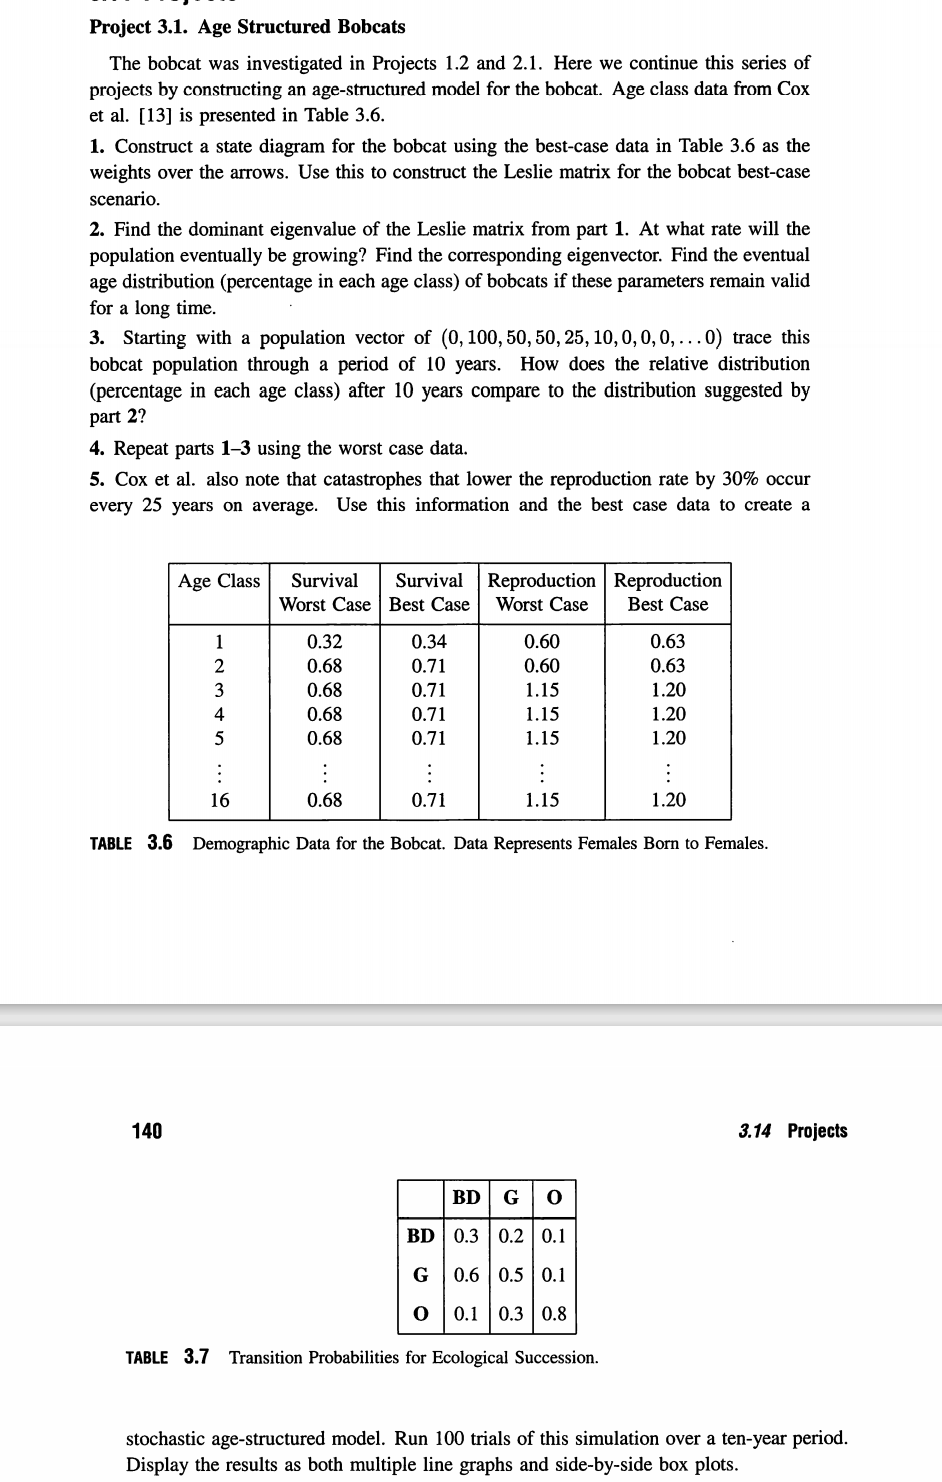
Project 1.2. Bobcats Most species of wild cats are endangered including the bobcat. This project explores the behavior of a bobcat population using growth rate data from the state of Florida (from Cox, et. al., Closing the Gaps in Florida's Wildlife Habitat Conservation System [13]). We know annual growth rates for bobcats under best (r = 0.01676), medium (r = 0.00549), and worst (r = -0.04500) environmental conditions. For this project, Cumulative Payment Balance @ Interest Payments Annual Interest Rate Monthly Interest Rate FIGURE 1.25 A More Refined Model 40 1.9 Projects assume that growth rates are constant from year to year (complications will come later). For now consider each growth rate as representing a different region in Florida. 1. Construct a spreadsheet (or other simulation) tracking three bobcat populations, each initially consisting of 100 individuals, over a period of 10 years under the three types of environmental conditions. Plot all three simulations on a single graph. The graph should have dates on the horizontal axis (starting with the current year), it should have a legend identifying which curve is which, and the style should have each curve identifiable when printed in black ink. 2. Repeat part 1 over a period of 25 years. 3. You should have noticed that under the best conditions the population is growing. Several management plans have been discussed. The first is to allow one bobcat per year to be hunted. The second is to allow five bobcats per year to be hunted. The third is to allow one percent of the animals to be hunted. The last is to let five percent of the animals be hunted. Construct a simulation which compares these strategies over 10 and 25 years. Which of these strategies result in a stable population? 2.7 Projects Project 2.1. Stochastic Bobcats This project investigates demographic and environmental stochasticity for the bobcats considered in Project 1.2. For this project assume that bobcats have a mean birth rate of 0.4 with a standard deviation of 0.1 and a mean survival rate of 0.68 with a standard deviation of 0.07. In this model, assume that these demographic parameters follow a normal distribution. Environmental stochasticity can take many forms. For this project it will take the form of a catastrophe which occurs an average of once every 25 years or 4% of the time. These catastrophes affect both the bobcat birth and bobcat survival rates by decreasing both rates by 30% during the year that the catastrophe occurred. For all parts of this project, assume an initial bobcat population of 100. 1. Deterministic. Construct and run a deterministic model for the bobcats using the birth rate of 0.4 and the survival rate of 0.68, but ignoring all random factors. Graph 94 2.7 Projects the population over a 20-year period with these parameters and make a table of this information. 2. Demographic Stochasticity. Create a new model using only the demographic stochastic information. Make a graph and a data table with at least 50 runs for 20 years. 3. Environmental Stochasticity. Now construct a model using only environmental stochasticity. Again construct a data table and graph for at least 50 runs of this case for 20 years. 4. Take the data from the 20th year of both stochastic models and, if necessary, export it to a program that calculates statistics. Make histograms and box plots. Make reports of the following summary statistics: mean, median, 25th and 75th percentiles, standard deviation, range, inter-quartile range, minimum, and maximum. Compare the results from these two models. 5. For each model construct a graph with side-by-side box plots for the first 10 years showing the change in distribution over time. Compare both of these models with each other and with the deterministic model. 6. From the work so far, which stochastic effect is more pronounced? Either construct and analyze a model with both demographic and environmental stochastic effects, or argue that the combined effects will not be significantly different from the individual effects so there is no need to complicate the model. Project 3.1. Age Structured Bobcats The bobcat was investigated in Projects 1.2 and 2.1. Here we continue this series of projects by constructing an age-structured model for the bobcat. Age class data from Cox et al. [13] is presented in Table 3.6. 1. Construct a state diagram for the bobcat using the best-case data in Table 3.6 as the weights over the arrows. Use this to construct the Leslie matrix for the bobcat best-case scenario. 2. Find the dominant eigenvalue of the Leslie matrix from part 1. At what rate will the population eventually be growing? Find the corresponding eigenvector. Find the eventual age distribution (percentage in each age class) of bobcats if these parameters remain valid for a long time. 3. Starting with a population vector of (0, 100, 50, 50, 25, 10,0,0,0,...0) trace this bobcat population through a period of 10 years. How does the relative distribution (percentage in each age class) after 10 years compare to the distribution suggested by part 2? 4. Repeat parts 1-3 using the worst case data. 5. Cox et al. also note that catastrophes that lower the reproduction rate by 30% occur every 25 years on average. Use this information and the best case data to create a Age Class Survival Survival Reproduction Reproduction Worst Case Best Case Worst Case Best Case 1 2 3 4 5 0.32 0.68 0.68 0.68 0.68 0.34 0.71 0.71 0.71 0.71 0.60 0.60 1.15 1.15 1.15 0.63 0.63 1.20 1.20 1.20 : 16 : 1.15 0.68 0.71 1.20 TABLE 3.6 Demographic Data for the Bobcat. Data Represents Females Born to Females. 140 3.14 Projects BD Go BD 0.3 0.2 0.1 G 0.6 0.5 0.1 0 0.1 0.3 0.8 TABLE 3.7 Transition Probabilities for Ecological Succession. stochastic age-structured model. Run 100 trials of this simulation over a ten-year period. Display the results as both multiple line graphs and side-by-side box plots. Project 1.2. Bobcats Most species of wild cats are endangered including the bobcat. This project explores the behavior of a bobcat population using growth rate data from the state of Florida (from Cox, et. al., Closing the Gaps in Florida's Wildlife Habitat Conservation System [13]). We know annual growth rates for bobcats under best (r = 0.01676), medium (r = 0.00549), and worst (r = -0.04500) environmental conditions. For this project, Cumulative Payment Balance @ Interest Payments Annual Interest Rate Monthly Interest Rate FIGURE 1.25 A More Refined Model 40 1.9 Projects assume that growth rates are constant from year to year (complications will come later). For now consider each growth rate as representing a different region in Florida. 1. Construct a spreadsheet (or other simulation) tracking three bobcat populations, each initially consisting of 100 individuals, over a period of 10 years under the three types of environmental conditions. Plot all three simulations on a single graph. The graph should have dates on the horizontal axis (starting with the current year), it should have a legend identifying which curve is which, and the style should have each curve identifiable when printed in black ink. 2. Repeat part 1 over a period of 25 years. 3. You should have noticed that under the best conditions the population is growing. Several management plans have been discussed. The first is to allow one bobcat per year to be hunted. The second is to allow five bobcats per year to be hunted. The third is to allow one percent of the animals to be hunted. The last is to let five percent of the animals be hunted. Construct a simulation which compares these strategies over 10 and 25 years. Which of these strategies result in a stable population? 2.7 Projects Project 2.1. Stochastic Bobcats This project investigates demographic and environmental stochasticity for the bobcats considered in Project 1.2. For this project assume that bobcats have a mean birth rate of 0.4 with a standard deviation of 0.1 and a mean survival rate of 0.68 with a standard deviation of 0.07. In this model, assume that these demographic parameters follow a normal distribution. Environmental stochasticity can take many forms. For this project it will take the form of a catastrophe which occurs an average of once every 25 years or 4% of the time. These catastrophes affect both the bobcat birth and bobcat survival rates by decreasing both rates by 30% during the year that the catastrophe occurred. For all parts of this project, assume an initial bobcat population of 100. 1. Deterministic. Construct and run a deterministic model for the bobcats using the birth rate of 0.4 and the survival rate of 0.68, but ignoring all random factors. Graph 94 2.7 Projects the population over a 20-year period with these parameters and make a table of this information. 2. Demographic Stochasticity. Create a new model using only the demographic stochastic information. Make a graph and a data table with at least 50 runs for 20 years. 3. Environmental Stochasticity. Now construct a model using only environmental stochasticity. Again construct a data table and graph for at least 50 runs of this case for 20 years. 4. Take the data from the 20th year of both stochastic models and, if necessary, export it to a program that calculates statistics. Make histograms and box plots. Make reports of the following summary statistics: mean, median, 25th and 75th percentiles, standard deviation, range, inter-quartile range, minimum, and maximum. Compare the results from these two models. 5. For each model construct a graph with side-by-side box plots for the first 10 years showing the change in distribution over time. Compare both of these models with each other and with the deterministic model. 6. From the work so far, which stochastic effect is more pronounced? Either construct and analyze a model with both demographic and environmental stochastic effects, or argue that the combined effects will not be significantly different from the individual effects so there is no need to complicate the model. Project 3.1. Age Structured Bobcats The bobcat was investigated in Projects 1.2 and 2.1. Here we continue this series of projects by constructing an age-structured model for the bobcat. Age class data from Cox et al. [13] is presented in Table 3.6. 1. Construct a state diagram for the bobcat using the best-case data in Table 3.6 as the weights over the arrows. Use this to construct the Leslie matrix for the bobcat best-case scenario. 2. Find the dominant eigenvalue of the Leslie matrix from part 1. At what rate will the population eventually be growing? Find the corresponding eigenvector. Find the eventual age distribution (percentage in each age class) of bobcats if these parameters remain valid for a long time. 3. Starting with a population vector of (0, 100, 50, 50, 25, 10,0,0,0,...0) trace this bobcat population through a period of 10 years. How does the relative distribution (percentage in each age class) after 10 years compare to the distribution suggested by part 2? 4. Repeat parts 1-3 using the worst case data. 5. Cox et al. also note that catastrophes that lower the reproduction rate by 30% occur every 25 years on average. Use this information and the best case data to create a Age Class Survival Survival Reproduction Reproduction Worst Case Best Case Worst Case Best Case 1 2 3 4 5 0.32 0.68 0.68 0.68 0.68 0.34 0.71 0.71 0.71 0.71 0.60 0.60 1.15 1.15 1.15 0.63 0.63 1.20 1.20 1.20 : 16 : 1.15 0.68 0.71 1.20 TABLE 3.6 Demographic Data for the Bobcat. Data Represents Females Born to Females. 140 3.14 Projects BD Go BD 0.3 0.2 0.1 G 0.6 0.5 0.1 0 0.1 0.3 0.8 TABLE 3.7 Transition Probabilities for Ecological Succession. stochastic age-structured model. Run 100 trials of this simulation over a ten-year period. Display the results as both multiple line graphs and side-by-side box plotsStep by Step Solution
There are 3 Steps involved in it
Step: 1

Get Instant Access to Expert-Tailored Solutions
See step-by-step solutions with expert insights and AI powered tools for academic success
Step: 2

Step: 3
Ace Your Homework with AI
Get the answers you need in no time with our AI-driven, step-by-step assistance
Get Started
Ethical Obligations And Decision Making In Accounting Text And Cases
Authors: Steven Mintz, Roselyn Morris
2nd Edition
0078025281, 9780078025280