Question
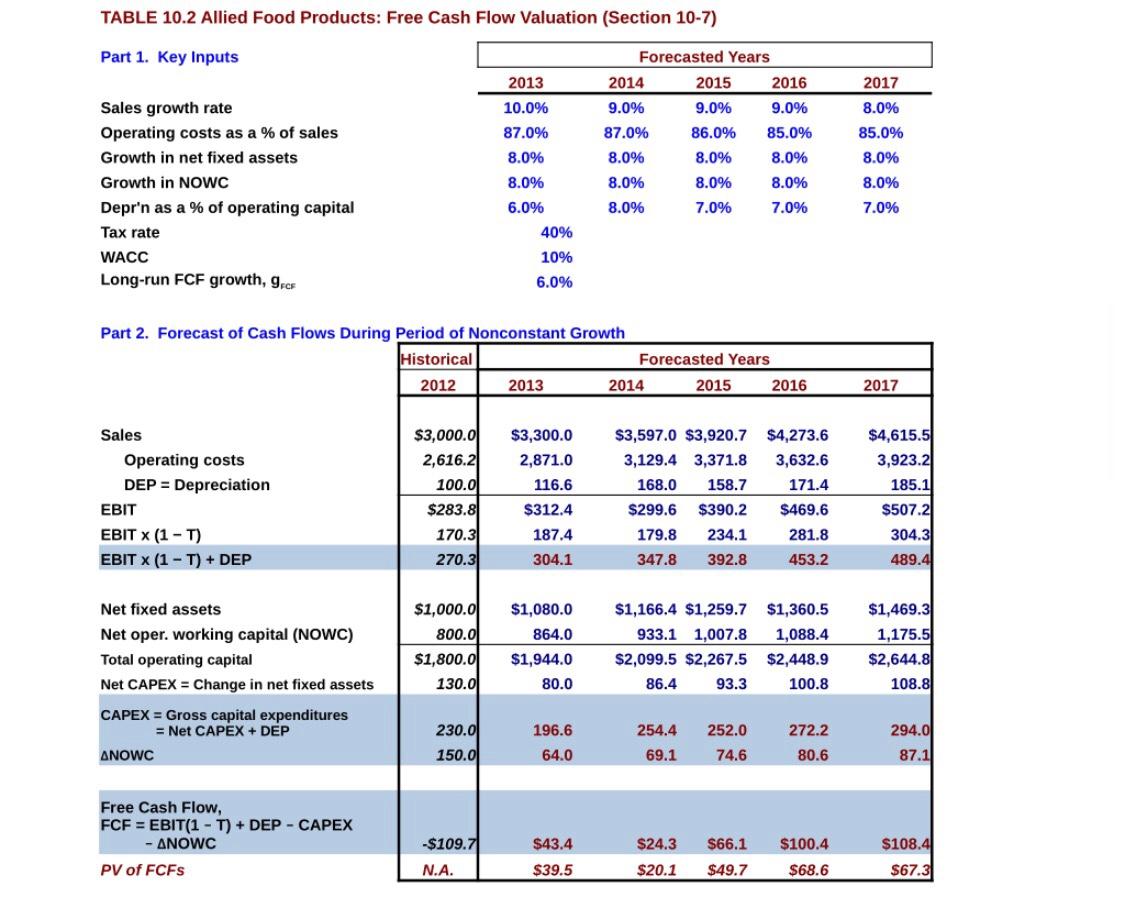
-Finish the following several questions using the corporate valuation model. (provide the number without any unite and accurate to two decimal place) 1. if the
 -Finish the following several questions using the corporate valuation model. (provide the number without any unite and accurate to two decimal place)
1. if the sales in 2012 is 5000 then how much is the Intrinsic Value Per Share in 2012?
2. if the sales growth rate is 8% in 2016 then how much is the Intrinsic Value Per Share in 2012?
3. if the operating cost is 2000 in 2012 then how much is the Intrinsic Value Per Share in 2012?
4. if the tax rate is 20% for all the years then how much is the Intrinsic Value Per Share in 2012?
5. if the wacc is 14% for all the years then how much is the Intrinsic Value Per Share in 2012?
TABLE 10.2 Allied Food Products: Free Cash Flow Valuation (Section 10-7) Part 1. Key Inputs Forecasted Years 2014 2015 2016 2013 10.0% 9.0% 9.0% 86.0% 8.0% 87.0% 2017 8.0% 85.0% 8.0% 9.0% 85.0% 8.0% 8.0% 87.0% 8.0% 8.0% 8.0% 8.0% Sales growth rate Operating costs as a % of sales Growth in net fixed assets Growth in NOWC Depr'n as a % of operating capital Tax rate WACC Long-run FCF growth, ECE 8.0% 8.0% 7.0% 8.0% 7.0% 6.0% 7.0% 40% 10% 6.0% Part 2. Forecast of Cash Flows During period of Nonconstant Growth Historical Forecasted Years 2012 2013 2014 2015 2016 2017 Sales Operating costs DEP = Depreciation $3,000.00 2,616.21 100.0 $283.80 $3,300.0 2,871.0 116.6 $312.4 $3,597.0 $3,920.7 3,129.4 3,371.8 168.0 158.7 $299.6 $390.2 179.8 234.1 $4,273.6 3,632.6 171.4 $469.6 281.8 $4,615.5 3,923.2 185.1 $507.2 304.3 489.4 EBIT 170.3 187.4 EBIT X (1-T) EBIT X (1 - T) + DEP 270.3 304.1 347.8 392.8 453.2 $1,080.0 864.0 Net fixed assets Net oper. working capital (NOWC) Total operating capital Net CAPEX = Change in net fixed assets CAPEX = Gross capital expenditures = Net CAPEX + DEP ANOWC $1,000.00 800.0 $1,800.00 130.0 $1,166.4 $1,259.7 $1,360.5 933.1 1.007.8 1,088.4 $2,099.5 $2,267.5 $2,448.9 86.4 93.3 100.8 $1,469.3 1,175.5 $2,644.8 108.8 $1,944.0 80.0 230.01 196.6 254.4 252.0 294.0 272.2 80.6 150.0 64.0 69.1 74.6 87.1 Free Cash Flow, FCF = EBIT(1 - T) + DEP - CAPEX - ANOWC PV of FCFs -$109.71 $43.4 $108.4 $24.3 $20.1 $66.1 $49.7 $100.4 $68.6 N.A. $39.5 $67.3 TABLE 10.2 Allied Food Products: Free Cash Flow Valuation (Section 10-7) Part 1. Key Inputs Forecasted Years 2014 2015 2016 2013 10.0% 9.0% 9.0% 86.0% 8.0% 87.0% 2017 8.0% 85.0% 8.0% 9.0% 85.0% 8.0% 8.0% 87.0% 8.0% 8.0% 8.0% 8.0% Sales growth rate Operating costs as a % of sales Growth in net fixed assets Growth in NOWC Depr'n as a % of operating capital Tax rate WACC Long-run FCF growth, ECE 8.0% 8.0% 7.0% 8.0% 7.0% 6.0% 7.0% 40% 10% 6.0% Part 2. Forecast of Cash Flows During period of Nonconstant Growth Historical Forecasted Years 2012 2013 2014 2015 2016 2017 Sales Operating costs DEP = Depreciation $3,000.00 2,616.21 100.0 $283.80 $3,300.0 2,871.0 116.6 $312.4 $3,597.0 $3,920.7 3,129.4 3,371.8 168.0 158.7 $299.6 $390.2 179.8 234.1 $4,273.6 3,632.6 171.4 $469.6 281.8 $4,615.5 3,923.2 185.1 $507.2 304.3 489.4 EBIT 170.3 187.4 EBIT X (1-T) EBIT X (1 - T) + DEP 270.3 304.1 347.8 392.8 453.2 $1,080.0 864.0 Net fixed assets Net oper. working capital (NOWC) Total operating capital Net CAPEX = Change in net fixed assets CAPEX = Gross capital expenditures = Net CAPEX + DEP ANOWC $1,000.00 800.0 $1,800.00 130.0 $1,166.4 $1,259.7 $1,360.5 933.1 1.007.8 1,088.4 $2,099.5 $2,267.5 $2,448.9 86.4 93.3 100.8 $1,469.3 1,175.5 $2,644.8 108.8 $1,944.0 80.0 230.01 196.6 254.4 252.0 294.0 272.2 80.6 150.0 64.0 69.1 74.6 87.1 Free Cash Flow, FCF = EBIT(1 - T) + DEP - CAPEX - ANOWC PV of FCFs -$109.71 $43.4 $108.4 $24.3 $20.1 $66.1 $49.7 $100.4 $68.6 N.A. $39.5 $67.3Step by Step Solution
There are 3 Steps involved in it
Step: 1

Get Instant Access to Expert-Tailored Solutions
See step-by-step solutions with expert insights and AI powered tools for academic success
Step: 2

Step: 3

Ace Your Homework with AI
Get the answers you need in no time with our AI-driven, step-by-step assistance
Get Started


