Answered step by step
Verified Expert Solution
Link Copied!

Question

1 Approved Answer

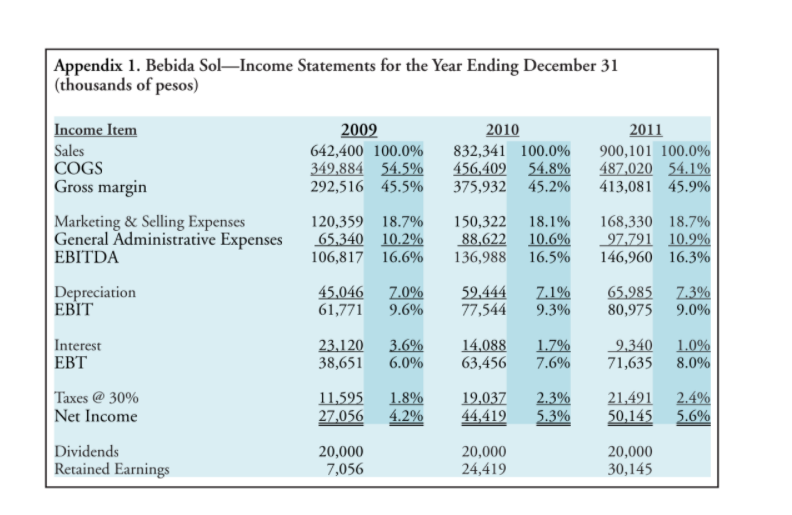
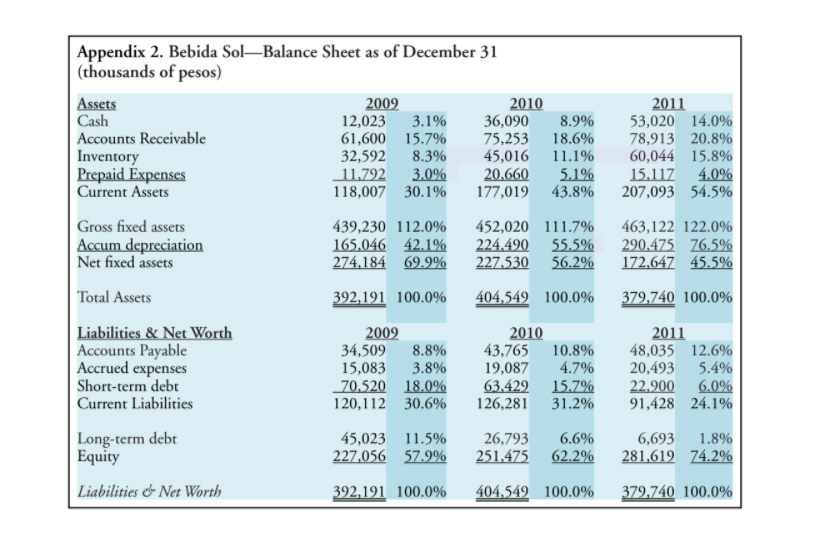
First add these assumptions to the Income statement and balance. Then work through the discounted cash flow analysis. The soft drink market in Mexico is

  1. First add these assumptions to the Income statement and balance. Then work through the discounted cash flow analysis.

  2. The soft drink market in Mexico is growing at a compounded annual rate of 6.3% (4.5% CAGR from volume & 1.7% CAGR from price ). Bebida Sol will hope, and lets assume, that if Hola-Kola is launched it will experience annual volume (liters) increases of 3.75% in years 2 through 5, and annual price (pesos) increases of 1.25% in years 2 through 5.

  3. Bebida Sol will instead purchase new machinery with an all-in cost of 54 million pesos. The maximum production capacity of this new machinery is 775,000 liters per month. This machinery will be depreciated straight-line to zero value over 5 years, and at the end of year 5 this machinery is expected to sell for 4.4 million pesos.

  4. The estimated annual increase in business space rental costs is 3.7% in years 2 through 5.

  5. The estimated annual increase in operating costs in years 2 through 5 is 1.3% for raw materials, 2.5% for labor, and 2.6% for energy.

  6. General, administrative, and selling expenses will experience an annual increase of 3.4% in years 2 through 5.

  7. The cost allocation by the accounting department of 1.5% of sales is to create fully-burdened income statements for each product family. This allocation does not involve any expenditure of pesos.

  8. Any erosion that Hola-Kola generates from Bebida Sols existing product lines will likely also increase every year. Our estimate is the annual increase in erosion is 3.3%.

  9. All working capital accounts discussed in page 4 of the case text will increase in year 1 through 4, to maintain the same relationship to raw materials, sales revenue, and purchases from vendors (all for raw materials), as stated in the relevant paragraph. Remember NWC balances at the end of year 0 support year 1 operations. Year 1 support year 2 operations, and so on.

As you work through your discounted cash flow analysis of Hola-Kola, be sure to answer the following questions:

  1. What are the investment cash outflows for Hola-Kola (years 0 through 4)?

  2. What are the operating cash inflows for Hola-Kola (years 1 through 5)?

  3. What are the terminal cash flows for Hola-Kola (year 5)?

  4. What are the total incremental cash flows for Hola-Kola (years 0 through 5)?

  5. What is the payback period, net present value, and internal rate of return from Hola-Kola?

  6. Should owner/CEO Antonio Ortega accept or reject the Hola-Kola proposal?

  7. Suppose another competitor in carbonated soft drinks, who competes in the same market niche as Bebida Sol, is also considering an investment in a zero-calorie carbonate. What impact should this knowledge have on the net present value of Hola-Kola? I am looking for a precise peso amount here. It should take you about 6 minutes to get your solution; 5 minutes to figure it out and 1 minute to calculate the precise peso amount.image text in transcribedimage text in transcribed

Appendix 1. Bebida SolIncome Statements for the Year Ending December 31 (thousands of pesos) 2002 642,400 100.0% 349,884 54.5% 292,516 45.5% 2010 832,341 100.0% 456,409 54.8% 375,932 45.2% 2011 900,101 100.0% 487,020 34.1% 413,081 45.9% Income Item Sales COGS Gross margin Marketing & Selling Expenses General Administrative Expenses EBITDA Depreciation EBIT 120,359 18.7% 65,340 10.2% 106,817 16.6% 150,322 88,622 136,988 18.1% 10.6% 16.5% 168,330 18.7% 97.791 10.9% 146,960 16.3% 45,046 61,771 7.0% 9.6% 59,444 77,544 7.1% 9.3% 65,985 80,975 7.3% 9.0% Interest EBT 23.120 38,651 3.6% 6.0% 14,088 63,456 1.7% 7.6% 9.340 71,635 1.0% 8.0% 11,595 27,056 1.8% 4.2% 19,037 44,412 2.3% 5.3% 21,491 50,145 2.4% 5.6% Taxes @ 30% Net Income Dividends Retained Earnings 20,000 7,056 20,000 24,419 20,000 30,145 Appendix 2. Bebida SolBalance Sheet as of December 31 (thousands of pesos) Assets 2009 2010 Cash 12,023 3.1% 36,090 8.9% Accounts Receivable 61,600 15.7% 75,253 18.6% Inventory 32,592 8.3% 45,016 11.1% Prepaid Expenses 11,792 3.0% 20,660 5.1% Current Assets 118,007 30.1% 177,019 43.8% 2011 53,020 14.0% 78,913 20.8% 60,044 15.8% 15.117 4.0% 207,093 54.5% 439,230 112.0% 165,046 42.1% 274,184 69.9% 452,020 111.7% 224.490 55.5% 227.530 56.2% 463,122 122.0% 290,475 76.5% 172,647 45.5% 392,191 100.0% 404,549 100.0% 379,740 100.0% Gross fixed assets Accum depreciation Net fixed assets Total Assets Liabilities & Net Worth Accounts Payable Accrued expenses Short-term debt Current Liabilities 2002 34,509 8.8% 15,083 3.8% 70,520 18.0% 120,112 30.6% 2010 43,765 19,087 63,429 126,281 10.8% 4.7% 15.7% 31.2% 2011 48,035 12.6% 20,493 5.4% 22.900 6.0% 91,428 24.1% Long-term debt Equity 45,023 11.5% 227,056 57.9% 26,793 251,475 6.6% 62.2% 6,693 1.8% 281,619 74.2% Liabilities & Net Worth 392,191 100.0% 404,549 100.0% 379,740 100.0% Appendix 1. Bebida SolIncome Statements for the Year Ending December 31 (thousands of pesos) 2002 642,400 100.0% 349,884 54.5% 292,516 45.5% 2010 832,341 100.0% 456,409 54.8% 375,932 45.2% 2011 900,101 100.0% 487,020 34.1% 413,081 45.9% Income Item Sales COGS Gross margin Marketing & Selling Expenses General Administrative Expenses EBITDA Depreciation EBIT 120,359 18.7% 65,340 10.2% 106,817 16.6% 150,322 88,622 136,988 18.1% 10.6% 16.5% 168,330 18.7% 97.791 10.9% 146,960 16.3% 45,046 61,771 7.0% 9.6% 59,444 77,544 7.1% 9.3% 65,985 80,975 7.3% 9.0% Interest EBT 23.120 38,651 3.6% 6.0% 14,088 63,456 1.7% 7.6% 9.340 71,635 1.0% 8.0% 11,595 27,056 1.8% 4.2% 19,037 44,412 2.3% 5.3% 21,491 50,145 2.4% 5.6% Taxes @ 30% Net Income Dividends Retained Earnings 20,000 7,056 20,000 24,419 20,000 30,145 Appendix 2. Bebida SolBalance Sheet as of December 31 (thousands of pesos) Assets 2009 2010 Cash 12,023 3.1% 36,090 8.9% Accounts Receivable 61,600 15.7% 75,253 18.6% Inventory 32,592 8.3% 45,016 11.1% Prepaid Expenses 11,792 3.0% 20,660 5.1% Current Assets 118,007 30.1% 177,019 43.8% 2011 53,020 14.0% 78,913 20.8% 60,044 15.8% 15.117 4.0% 207,093 54.5% 439,230 112.0% 165,046 42.1% 274,184 69.9% 452,020 111.7% 224.490 55.5% 227.530 56.2% 463,122 122.0% 290,475 76.5% 172,647 45.5% 392,191 100.0% 404,549 100.0% 379,740 100.0% Gross fixed assets Accum depreciation Net fixed assets Total Assets Liabilities & Net Worth Accounts Payable Accrued expenses Short-term debt Current Liabilities 2002 34,509 8.8% 15,083 3.8% 70,520 18.0% 120,112 30.6% 2010 43,765 19,087 63,429 126,281 10.8% 4.7% 15.7% 31.2% 2011 48,035 12.6% 20,493 5.4% 22.900 6.0% 91,428 24.1% Long-term debt Equity 45,023 11.5% 227,056 57.9% 26,793 251,475 6.6% 62.2% 6,693 1.8% 281,619 74.2% Liabilities & Net Worth 392,191 100.0% 404,549 100.0% 379,740 100.0%

Step by Step Solution

There are 3 Steps involved in it

Step: 1

blur-text-image

Get Instant Access to Expert-Tailored Solutions

See step-by-step solutions with expert insights and AI powered tools for academic success

Step: 2

blur-text-image

Step: 3

blur-text-image

Ace Your Homework with AI

Get the answers you need in no time with our AI-driven, step-by-step assistance

Get Started

Recommended Textbook for

Payroll Fraud Detection And Prevention Audit Expert System

Authors: Titus Oniyilo

1st Edition

136564345X, 978-1365643453

More Books

Students also viewed these Accounting questions

Question

In Exercises, find the indefinite integral. J (4x + x + 3) dx

Answered: 1 week ago