First assume there are no costs of financial distress. Exhibit 4 in the case provides an estimate of the value of UST as an unlevered firm. Estimate the firm value of UST under a hypothetical recapitalization with target debt to value ratios (that is, D/(D+E)) of 20%, 30%, 40%, and so on, up to 90%. To estimate bond interest rates, use exhibits A and B provided in this document. Interest coverage ratios are calculated as operating income divided by interest payments. Assume debt is issued as a perpetuity and tax shields are discounted using the ROA.
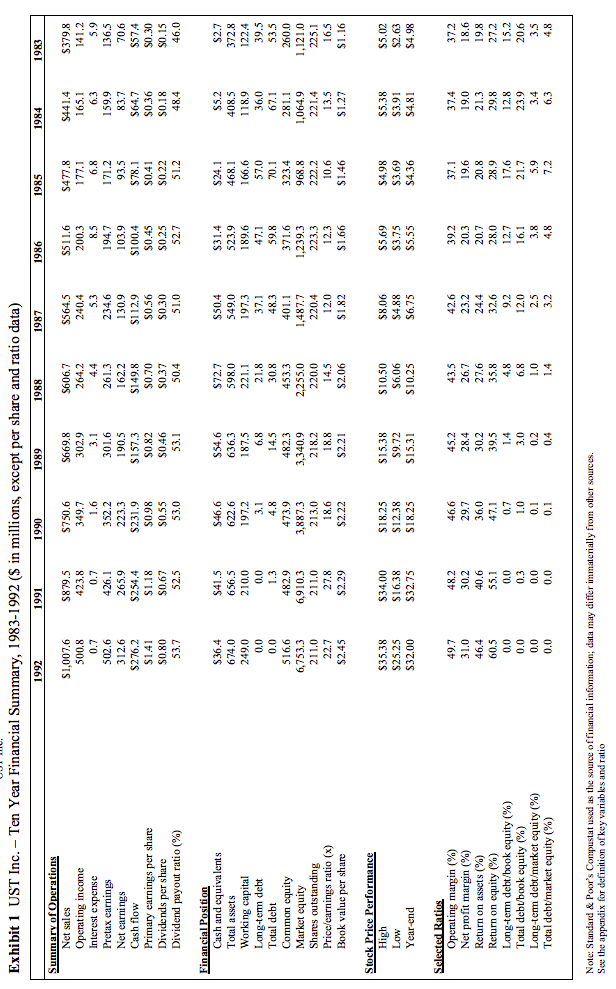
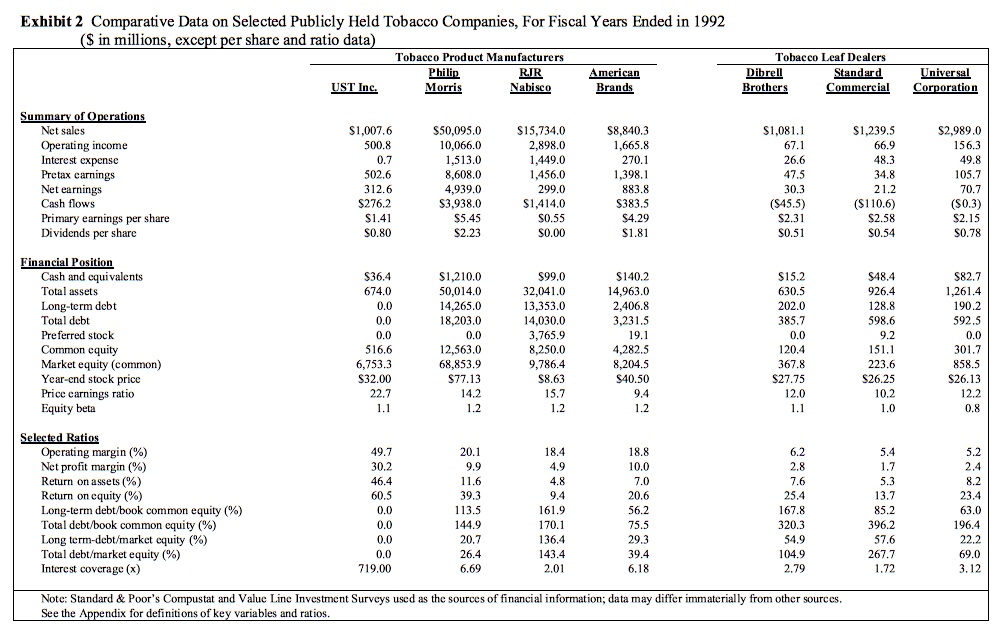
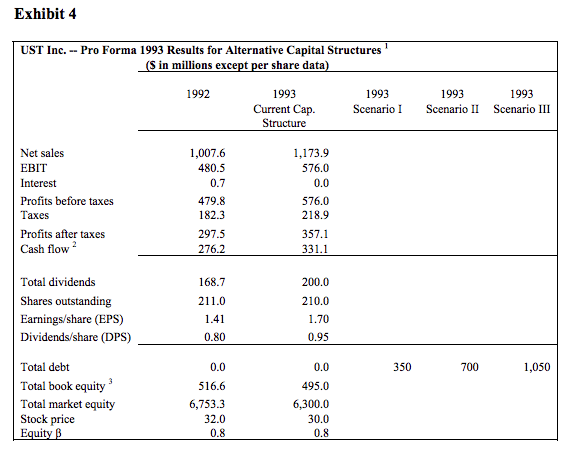
Exhibit 1 UST Inc. - Ten Year Financial Summary, 1983-1992 (S in millions, except per share and ratio data) 1984 1992 1990 Summarv of Operation $1,007.6 $879.5 423.8 S750.6 $564.5 240.4 Net sales Operating income Interest expense Pretax earnings Net earmings Cash flow Primary earnings per share Dividends per share Dividend payout ratio(%) S606.7 264.2 S379.8 500.8 0 302.9 200.3 194.7 103.9 $100.4 159.9 83.7 S64.7 S0.36 0 190.5 $157.3 S0.82 S0.46 136.5 265.9 $254.4 $1.18 130.9 S1 12.9 S0.56 $0.30 223.3 S276.2 $149.8 $0.70 S0.30 S0.55 S0.25 50.4 48.4 0 Cash and equiva lents Total assets Working capital Long-tem debt Total debt Common equity Market equity Shares outstanding Price/earnings ratio (x) Book value per share $72.7 598.0 221.1 S50.4 549.0 S2.7 468.1 166.6 674.0 656.5 210.0 622.6 197.2 523.9 189.6 408.5 122.4 30.8 0 323.4 482.9 260.0 473.9 1,064.9 6,753.3 3,340.9 1,487.7 220.0 $1.27 $2.29 $2.06 $1.46 $2.21 Stock Price Performance $34.00 $16.38 S32.75 $18.25 $12.38 S18.25 $10.50 $6.06 S10.25 S5.02 $2.63 S5.69 $25.25 $32.00 S3.91 Year-end S5.55 48.2 42.6 Operating margin (%) Net profit margin (%) Return on assets (%) Return on equity (%) Long-term debt/book equity (%) Total debt/book equity (%) Long-term debt/market equity (%) Total debt/market equity (%) 28.4 19.6 19.0 36.0 19.8 32.6 0.3 0 21.7 20.6 0 0.2 Note: Standard &Poor's Compustat used as the source offinancial information; data may differ immaterially See the appendix for definition of key variables and ratio from other sources. Exhibit 2 Comparative Data on Selected Publicly Held Tobacco Companies, For Fiscal Years Ended in 1992 $ in millions, exccpt per share and ratio data Tobacco Product Manufacturers Tobacco Leaf Dealers Standard Philip RIR American Brands UST Inc. Brothers Commercial Cornorat Summary of O perations $2,989.0 S50,095.0 10,066.0 1,513.0 8,608.0 4,939.0 S3,938.0 Net sales Operating income Interest expensc Pretax carnings Net earnings Cash flows Primary earnings per share Dividends per sharc S1,007.6 500.8 S15,734.0 2,898.0 1,449.0 1,456.0 $8,840.3 1,665.8 $1,081.1 S1,239.5 312.6 S276.2 883.8 S383.5 $4.29 $1,414.0 (S110.6) $2.31 $2.23 S0.80 S0.00 S0.54 inancial Position S15.2 630.5 202.0 385.7 S82.7 1,261.4 190.2 592.5 Cash and cquivalents Total assets S1,210.0 50,014.0 S99.0 32,041.0 13,353.0 14,030.0 3,765.9 8,250.0 S140.2 14,963.0 2,406.8 674.0 926.4 128.8 598.6 ng-term debt Total debt Preferred stock Common cquity Market equity (common) Year-end stock price Price earnings ratio 18,203.0 12,563.0 68,853.9 S77.13 4,282.5 8,204.5 $40.50 6,753.3 S32.00 223.6 S26.25 S26.13 12.0 beta Operating margin (%) Net profit margin (%) on assets (%) Return on equity (%) Long-term debt/book corn mon equity (%) Total debt/book common equity (%) Long terrn-debt/market equity (%) Total debt/market equity (%) Interest covcrage (x) 39.3 196.4 22.2 144.9 75.5 320.3 396.2 136.4 719.00 Note: Standard & Poor's Compustat and Value Line Investment Surveys used as the sources of financial information; data may differ immaterially from other sources. ndix for definitions of key variables and ratios Exhibit 4 UST Inc. --Pro Forma 1993 Results for Alternative Capital Structures in millions except per share data 1993 1992 1993 Current Cap Structure 1993 Scenario I ScenarioII Scenario III 1993 1,007.6 480.5 0.7 479.8 182.3 297.5 1,173.9 576.0 0.0 576.0 218.9 Net sale:s EBIT Interest Profits before taxes Taxes Profits after taxes Cash flow2 357.1 331.1 Total dividends Shares outstanding Earnings/share (EPS) Dividends/share (DPS) 200.0 210.0 1.70 0.95 168.7 211.0 1.41 0.80 Total debt Total book equity Total market equity Stock price 0.0 516.6 6,753.3 32.0 0.8 0.0 495.0 6,300.0 30.0 0.8 350 1,050 700 ui Exhibit 1 UST Inc. - Ten Year Financial Summary, 1983-1992 (S in millions, except per share and ratio data) 1984 1992 1990 Summarv of Operation $1,007.6 $879.5 423.8 S750.6 $564.5 240.4 Net sales Operating income Interest expense Pretax earnings Net earmings Cash flow Primary earnings per share Dividends per share Dividend payout ratio(%) S606.7 264.2 S379.8 500.8 0 302.9 200.3 194.7 103.9 $100.4 159.9 83.7 S64.7 S0.36 0 190.5 $157.3 S0.82 S0.46 136.5 265.9 $254.4 $1.18 130.9 S1 12.9 S0.56 $0.30 223.3 S276.2 $149.8 $0.70 S0.30 S0.55 S0.25 50.4 48.4 0 Cash and equiva lents Total assets Working capital Long-tem debt Total debt Common equity Market equity Shares outstanding Price/earnings ratio (x) Book value per share $72.7 598.0 221.1 S50.4 549.0 S2.7 468.1 166.6 674.0 656.5 210.0 622.6 197.2 523.9 189.6 408.5 122.4 30.8 0 323.4 482.9 260.0 473.9 1,064.9 6,753.3 3,340.9 1,487.7 220.0 $1.27 $2.29 $2.06 $1.46 $2.21 Stock Price Performance $34.00 $16.38 S32.75 $18.25 $12.38 S18.25 $10.50 $6.06 S10.25 S5.02 $2.63 S5.69 $25.25 $32.00 S3.91 Year-end S5.55 48.2 42.6 Operating margin (%) Net profit margin (%) Return on assets (%) Return on equity (%) Long-term debt/book equity (%) Total debt/book equity (%) Long-term debt/market equity (%) Total debt/market equity (%) 28.4 19.6 19.0 36.0 19.8 32.6 0.3 0 21.7 20.6 0 0.2 Note: Standard &Poor's Compustat used as the source offinancial information; data may differ immaterially See the appendix for definition of key variables and ratio from other sources. Exhibit 2 Comparative Data on Selected Publicly Held Tobacco Companies, For Fiscal Years Ended in 1992 $ in millions, exccpt per share and ratio data Tobacco Product Manufacturers Tobacco Leaf Dealers Standard Philip RIR American Brands UST Inc. Brothers Commercial Cornorat Summary of O perations $2,989.0 S50,095.0 10,066.0 1,513.0 8,608.0 4,939.0 S3,938.0 Net sales Operating income Interest expensc Pretax carnings Net earnings Cash flows Primary earnings per share Dividends per sharc S1,007.6 500.8 S15,734.0 2,898.0 1,449.0 1,456.0 $8,840.3 1,665.8 $1,081.1 S1,239.5 312.6 S276.2 883.8 S383.5 $4.29 $1,414.0 (S110.6) $2.31 $2.23 S0.80 S0.00 S0.54 inancial Position S15.2 630.5 202.0 385.7 S82.7 1,261.4 190.2 592.5 Cash and cquivalents Total assets S1,210.0 50,014.0 S99.0 32,041.0 13,353.0 14,030.0 3,765.9 8,250.0 S140.2 14,963.0 2,406.8 674.0 926.4 128.8 598.6 ng-term debt Total debt Preferred stock Common cquity Market equity (common) Year-end stock price Price earnings ratio 18,203.0 12,563.0 68,853.9 S77.13 4,282.5 8,204.5 $40.50 6,753.3 S32.00 223.6 S26.25 S26.13 12.0 beta Operating margin (%) Net profit margin (%) on assets (%) Return on equity (%) Long-term debt/book corn mon equity (%) Total debt/book common equity (%) Long terrn-debt/market equity (%) Total debt/market equity (%) Interest covcrage (x) 39.3 196.4 22.2 144.9 75.5 320.3 396.2 136.4 719.00 Note: Standard & Poor's Compustat and Value Line Investment Surveys used as the sources of financial information; data may differ immaterially from other sources. ndix for definitions of key variables and ratios Exhibit 4 UST Inc. --Pro Forma 1993 Results for Alternative Capital Structures in millions except per share data 1993 1992 1993 Current Cap Structure 1993 Scenario I ScenarioII Scenario III 1993 1,007.6 480.5 0.7 479.8 182.3 297.5 1,173.9 576.0 0.0 576.0 218.9 Net sale:s EBIT Interest Profits before taxes Taxes Profits after taxes Cash flow2 357.1 331.1 Total dividends Shares outstanding Earnings/share (EPS) Dividends/share (DPS) 200.0 210.0 1.70 0.95 168.7 211.0 1.41 0.80 Total debt Total book equity Total market equity Stock price 0.0 516.6 6,753.3 32.0 0.8 0.0 495.0 6,300.0 30.0 0.8 350 1,050 700 ui