Answered step by step
Verified Expert Solution
Question
1 Approved Answer
first, Calculate the ratios above for Target. Then answer the first 6 questions below After you have answered the 6 questions. Answer questions 7-11 that
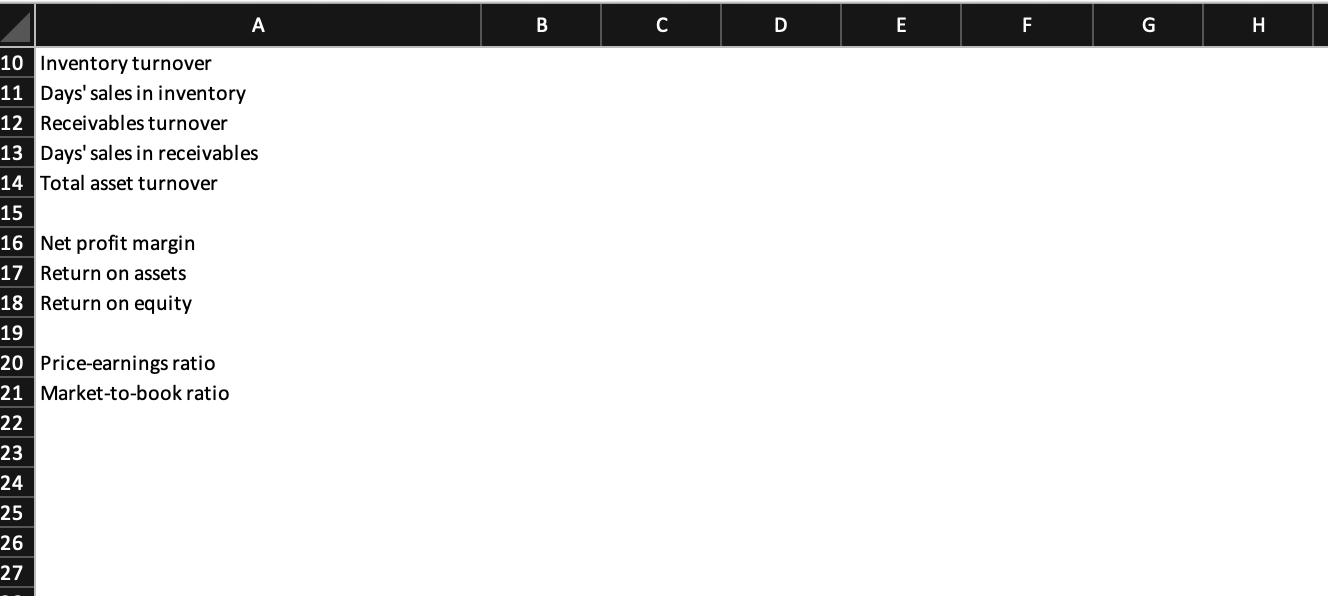
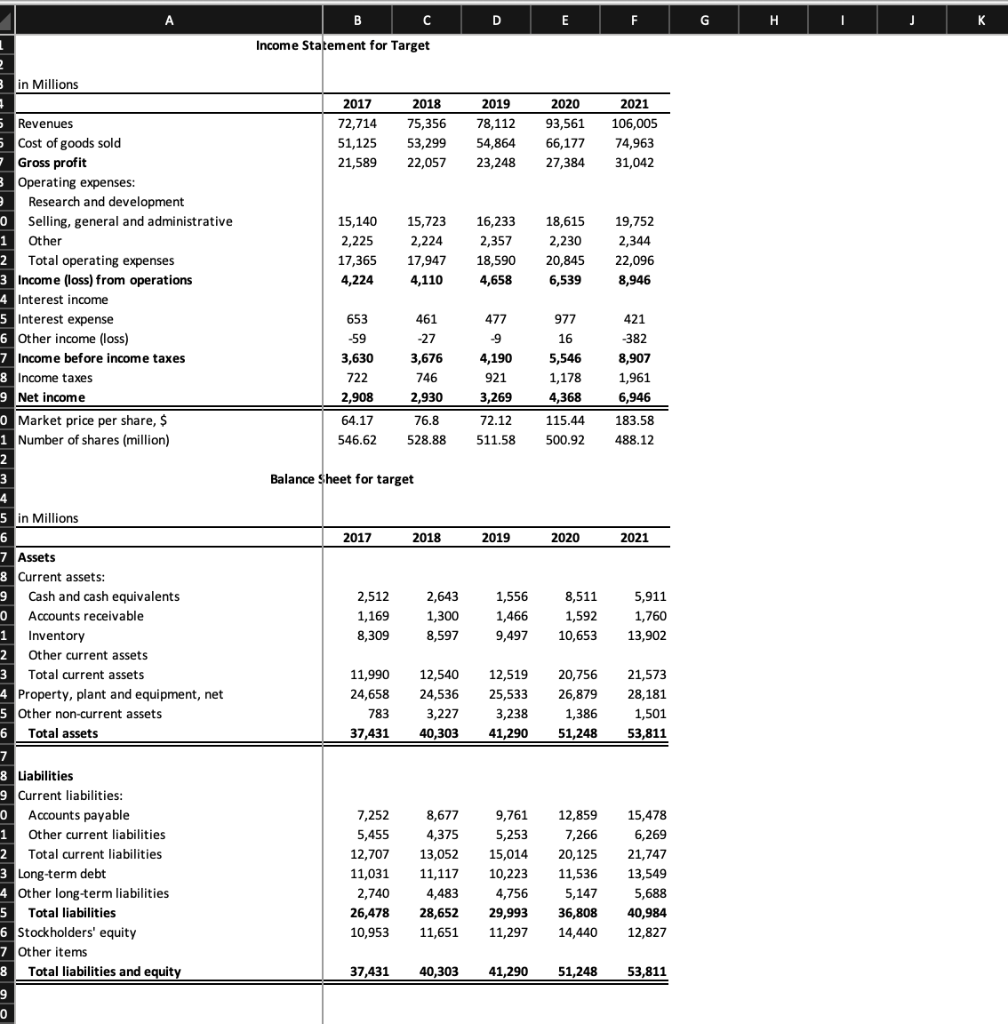
first, Calculate the ratios above for Target. Then answer the first 6 questions below
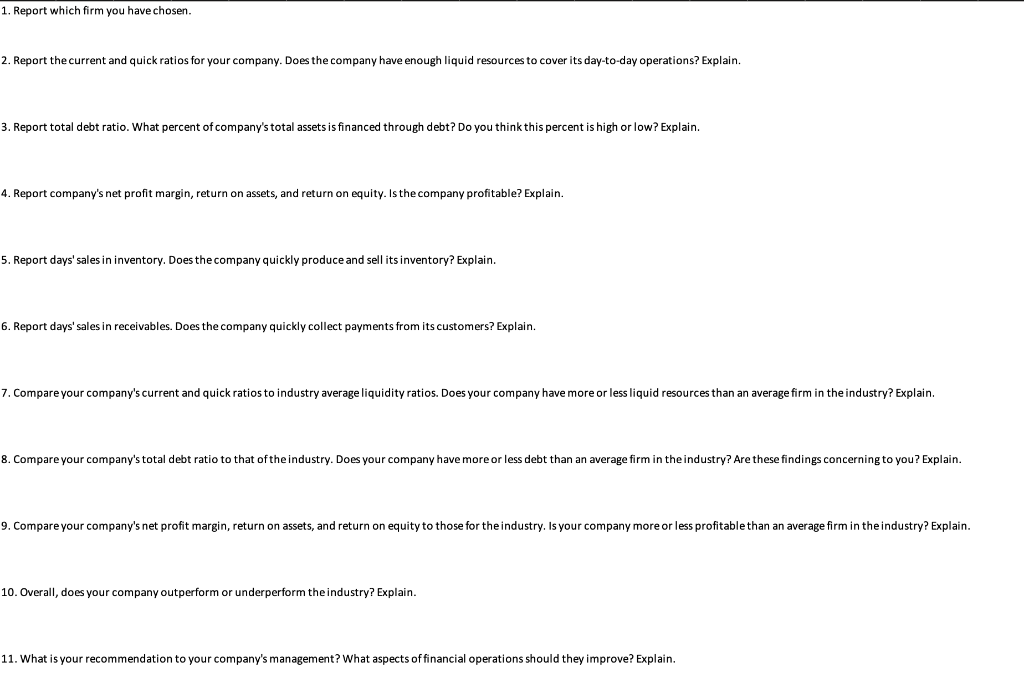
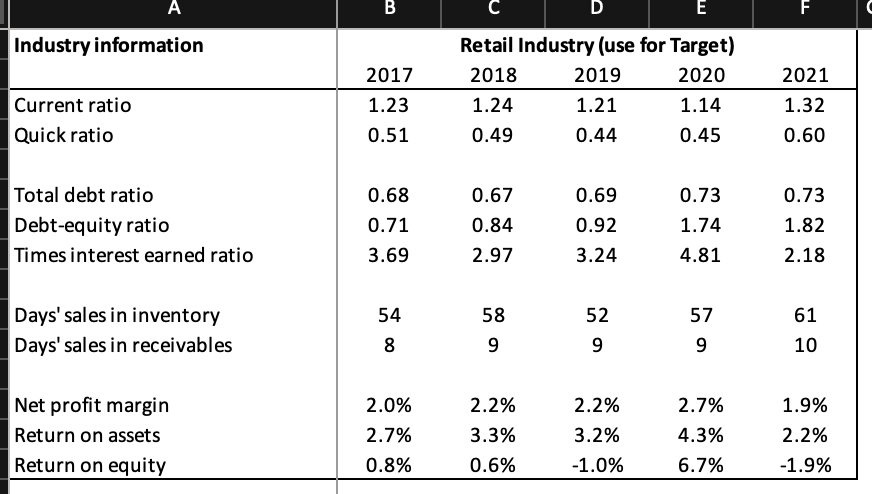
After you have answered the 6 questions. Answer questions 7-11 that compare target to the retail industry
Inventory turnover Days' sales in inventory Receivables turnover Days' sales in receivables Total asset turnover Net profit margin Return on assets Return on equity Price-earnings ratio Market-to-book ratio A \begin{tabular}{|l|l|l|l|l|l|l|l|l|l|l|} \hline & B & C & D & E & F & G & H & \\ \hline \end{tabular} Income Statement for Target in Millions \begin{tabular}{l|ccccc} \hline & 2017 & 2018 & 2019 & 2020 & 2021 \\ \hline Revenues & 72,714 & 75,356 & 78,112 & 93,561 & 106,005 \\ Cost of goods sold & 51,125 & 53,299 & 54,864 & 66,177 & 74,963 \\ Gross profit & 21,589 & 22,057 & 23,248 & 27,384 & 31,042 \\ Operating expenses: & & & & \\ \hline Research and development & & & & \\ Selling, general and administrative & 15,140 & 15,723 & 16,233 & 18,615 & 19,752 \\ Other & 2,225 & 2,224 & 2,357 & 2,230 & 2,344 \\ Total operating expenses & 17,365 & 17,947 & 18,590 & 20,845 & 22,096 \\ Income (loss) from operations & 4,224 & 4,110 & 4,658 & 6,539 & 8,946 \\ Interest income & & & & & \\ \hline Interest expense & 653 & 461 & 477 & 977 & 421 \\ \hline Other income (loss) & 59 & 27 & 9 & 16 & 382 \\ \hline Income before income taxes & 3,630 & 3,676 & 4,190 & 5,546 & 8,907 \\ Income taxes & 722 & 746 & 921 & 1,178 & 1,961 \\ \hline Net income & 2,908 & 2,930 & 3,269 & 4,368 & 6,946 \\ \hline \hline Market price per share, \$ & 64.17 & 76.8 & 72.12 & 115.44 & 183.58 \\ Number of shares (million) & 546.62 & 528.88 & 511.58 & 500.92 & 488.12 \\ \hline \end{tabular} Balance Sheet for target in Millions \begin{tabular}{l|rrrrr} \hline & 2017 & 2018 & 2019 & 2020 & 2021 \\ \hline Assets & & & & & \\ Current assets: & & & & \\ Cash and cash equivalents & 2,512 & 2,643 & 1,556 & 8,511 & 5,911 \\ Accounts receivable & 1,169 & 1,300 & 1,466 & 1,592 & 1,760 \\ Inventory & 8,309 & 8,597 & 9,497 & 10,653 & 13,902 \\ Other current assets & & & & & \\ Total current assets & 11,990 & 12,540 & 12,519 & 20,756 & 21,573 \\ Property, plant and equipment, net & 24,658 & 24,536 & 25,533 & 26,879 & 28,181 \\ Other non-current assets & 783 & 3,227 & 3,238 & 1,386 & 1,501 \\ Total assets & 37,431 & 40,303 & 41,290 & 51,248 & 53,811 \\ \hline \hline \end{tabular} Liabilities Current liabilities: Accounts payable Other current liabilities Total current liabilities Long-term debt Other long-term liabilities Total liabilities Stockholders' equity Other items Total liabilities and equity \begin{tabular}{lllll} 37,431 & 40,303 & 41,290 & 51,248 & 53,811 \\ \hline \end{tabular} 1. Report which firm you have chosen. 2. Report the current and quick ratios for your company. Does the company have enough liquid resources to cover its day-to-day operations? Explain. 3. Report total debt ratio. What percent of company's total assets is financed through debt? Do you think this percent is high or low? Explain. 4. Report company's net profit margin, return on assets, and return on equity. Is the company profitable? Explain. 5. Report days' sales in inventory. Does the company quickly produce and sell its inventory? Explain. 6. Report days' sales in receivables. Does the company quickly collect payments from its customers? Explain. 7. Compare your company's current and quick ratios to industry average liquidity ratios. Does your company have more or less liquid resources than an average firm in the industry? Explain. 8. Compare your company's total debt ratio to that of the industry. Does your company have more or less debt than an average firm in the industry? Are these findings concerning to you? Explain. 9. Compare your company's net profit margin, return on assets, and return on equity to those for the industry. Is your company more or less profitable than an average firm in the industry? Explain. 10. Overall, does your company outperform or underperform the industry? Explain. 11. What is your recommendation to your company's management? What aspects of financial operations should they improve? Explain. \begin{tabular}{|l|ccc|c|c|c|} \multicolumn{1}{c|}{ A } & B & C & D & E & F \\ \hline Industry information & \multicolumn{5}{c}{ Retail Industry (use for Target) } \\ & 2017 & 2018 & 2019 & 2020 & 2021 \\ \hline Current ratio & 1.23 & 1.24 & 1.21 & 1.14 & 1.32 \\ Quick ratio & 0.51 & 0.49 & 0.44 & 0.45 & 0.60 \\ & & & & & \\ Total debt ratio & 0.68 & 0.67 & 0.69 & 0.73 & 0.73 \\ Debt-equity ratio & 0.71 & 0.84 & 0.92 & 1.74 & 1.82 \\ Times interest earned ratio & 3.69 & 2.97 & 3.24 & 4.81 & 2.18 \\ & & & & & \\ Days' sales in inventory & 54 & 58 & 52 & 57 & 61 \\ Days' sales in receivables & 8 & 9 & 9 & 9 & 10 \\ & & & & & \\ Net profit margin & 2.0% & 2.2% & 2.2% & 2.7% & 1.9% \\ Return on assets & 2.7% & 3.3% & 3.2% & 4.3% & 2.2% \\ Return on equity & 0.8% & 0.6% & 1.0% & 6.7% & 1.9% \\ \hline \end{tabular}
Step by Step Solution
There are 3 Steps involved in it
Step: 1

Get Instant Access to Expert-Tailored Solutions
See step-by-step solutions with expert insights and AI powered tools for academic success
Step: 2

Step: 3

Ace Your Homework with AI
Get the answers you need in no time with our AI-driven, step-by-step assistance
Get Started


