First document is the problem; the rest are supplemental information to complete the problem. Thank you!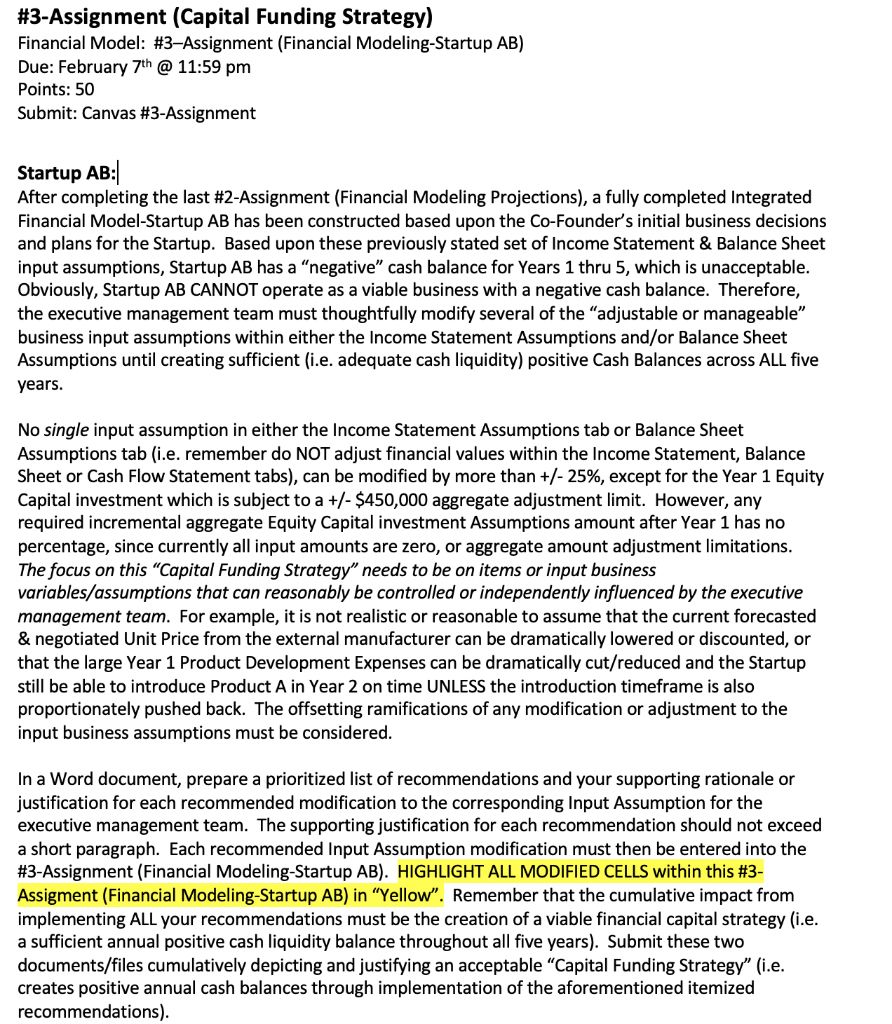
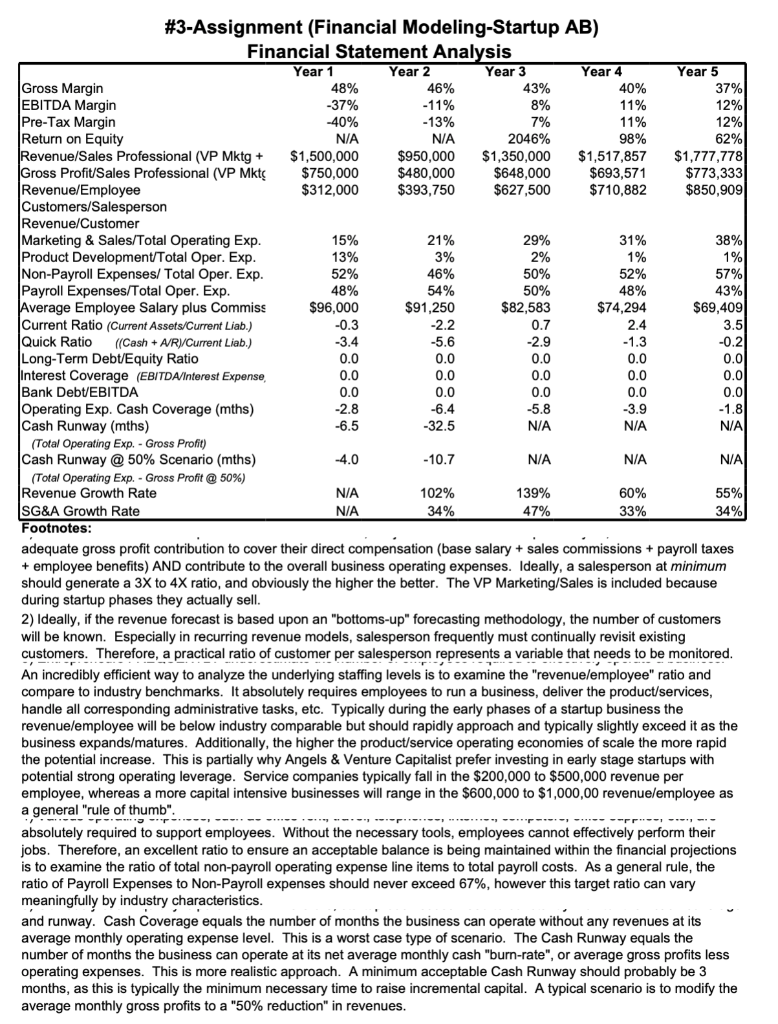
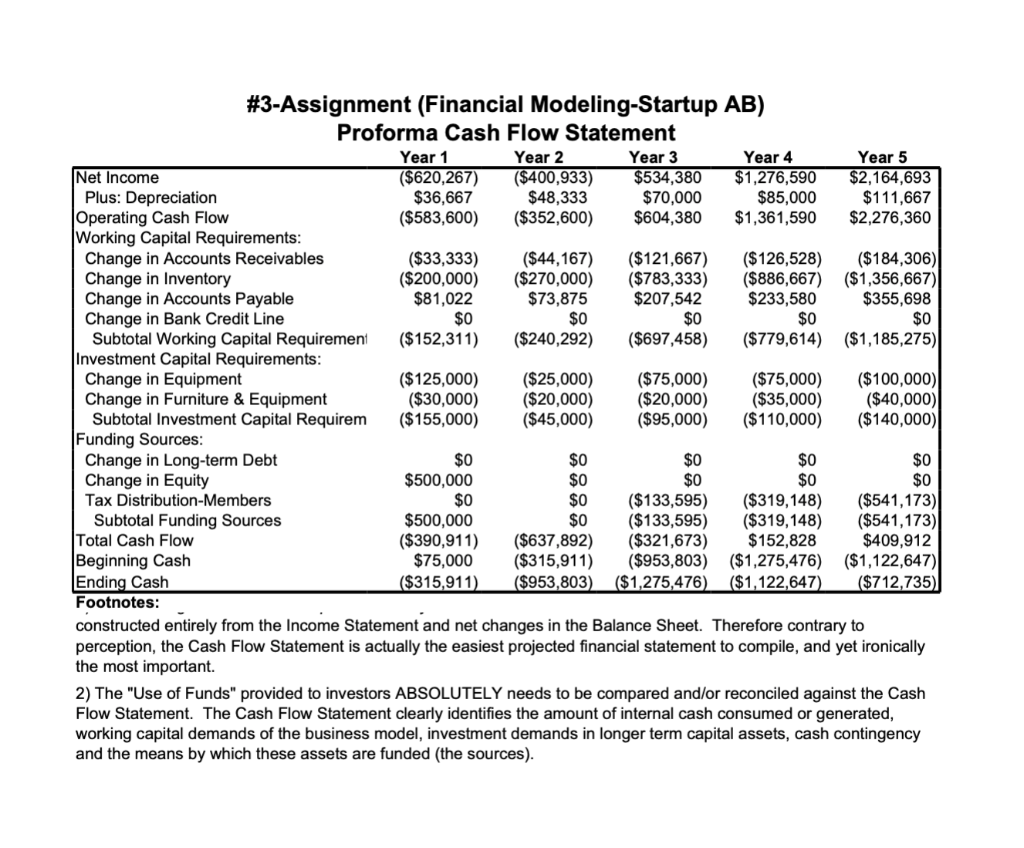
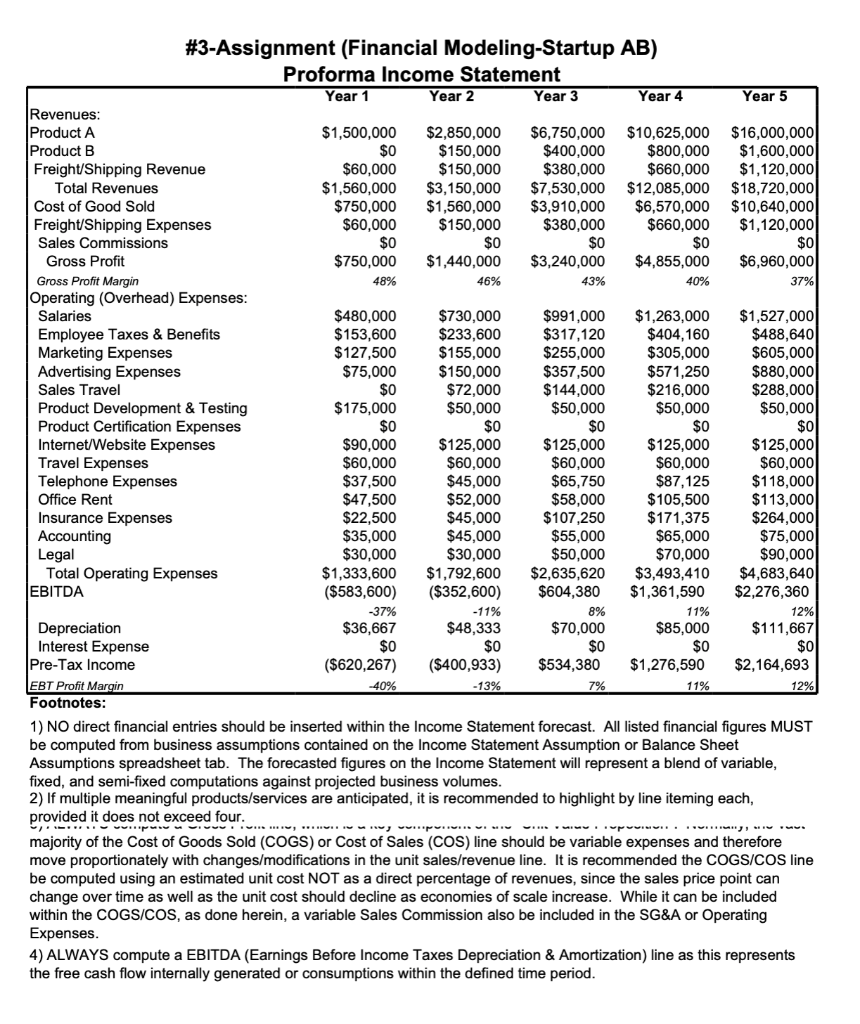
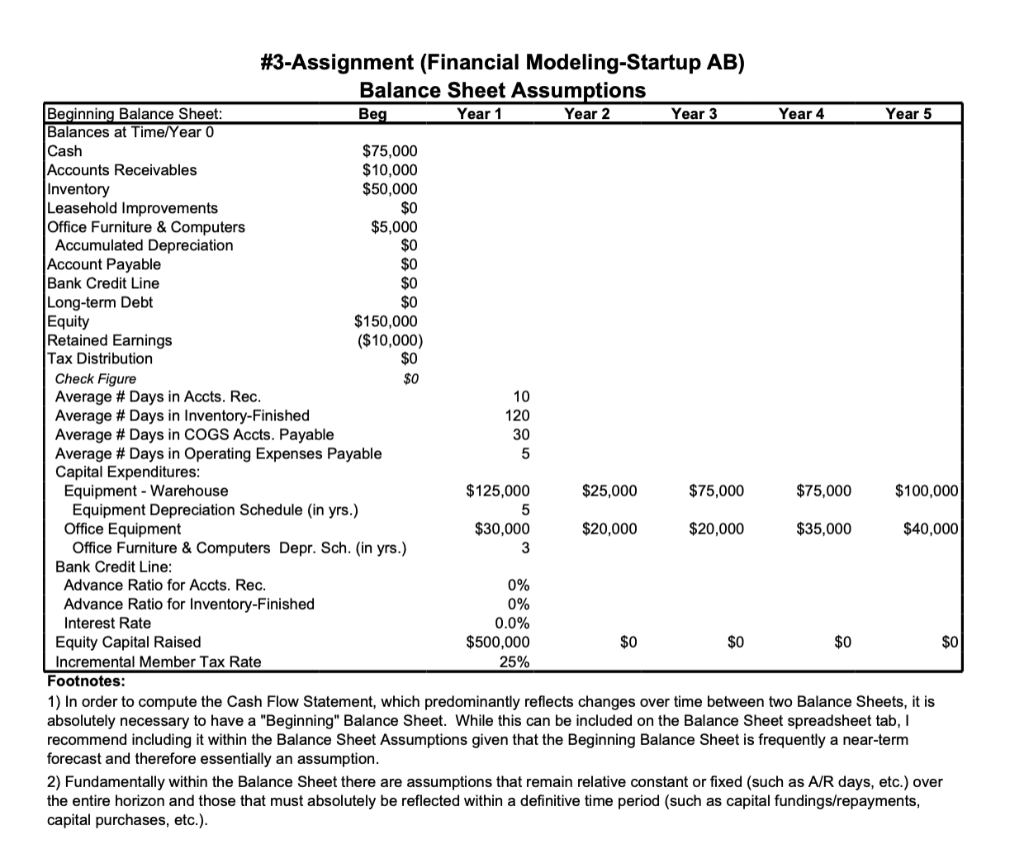
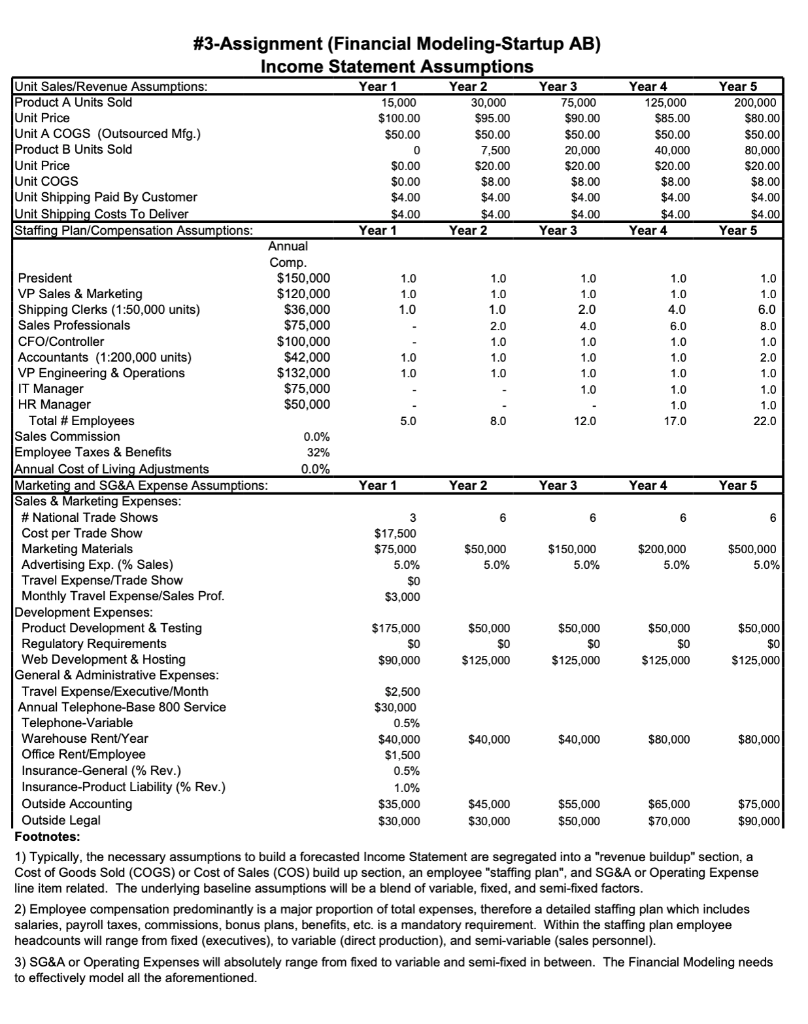
#3-Assignment (Capital Funding Strategy) Financial Model: #3-Assignment (Financial Modeling-Startup AB) Due: February 7th @ 11:59 pm Points: 50 Submit: Canvas #3-Assignment Startup AB: After completing the last #2-Assignment (Financial Modeling Projections), a fully completed Integrated Financial Model-Startup AB has been constructed based upon the Co-Founder's initial business decisions and plans for the Startup. Based upon these previously stated set of Income Statement & Balance Sheet input assumptions, Startup AB has a "negative" cash balance for Years 1 thru 5, which is unacceptable. Obviously, Startup AB CANNOT operate as a viable business with a negative cash balance. Therefore, the executive management team must thoughtfully modify several of the adjustable or manageable" business input assumptions within either the Income Statement Assumptions and/or Balance Sheet Assumptions until creating sufficient (i.e. adequate cash liquidity) positive Cash Balances across ALL five years. No single input assumption in either the Income Statement Assumptions tab or Balance Sheet Assumptions tab (i.e. remember do NOT adjust financial values within the Income Statement, Balance Sheet or Cash Flow Statement tabs), can be modified by more than +/- 25%, except for the Year 1 Equity Capital investment which is subject to a +/- $450,000 aggregate adjustment limit. However, any required incremental aggregate Equity Capital investment Assumptions amount after Year 1 has no percentage, since currently all input amounts are zero, or aggregate amount adjustment limitations. The focus on this "Capital Funding Strategy" needs to be on items or input business variables/assumptions that can reasonably be controlled or independently influenced by the executive management team. For example, it is not realistic or reasonable to assume that the current forecasted & negotiated Unit Price from the external manufacturer can be dramatically lowered or discounted, or that the large Year 1 Product Development Expenses can be dramatically cut/reduced and the Startup still be able to introduce Product A in Year 2 on time UNLESS the introduction timeframe is also proportionately pushed back. The offsetting ramifications of any modification or adjustment to the input business assumptions must be considered. In a Word document, prepare a prioritized list of recommendations and your supporting rationale or justification for each recommended modification to the corresponding Input Assumption for the executive management team. The supporting justification for each recommendation should not exceed a short paragraph. Each recommended Input Assumption modification must then be entered into the #3-Assignment (Financial Modeling-Startup AB). HIGHLIGHT ALL MODIFIED CELLS within this #3- Assigment (Financial Modeling-Startup AB) in Yellow. Remember that the cumulative impact from implementing ALL your recommendations must be the creation of a viable financial capital strategy (i.e. a sufficient annual positive cash liquidity balance throughout all five years). Submit these two documents/files cumulatively depicting and justifying an acceptable "Capital Funding Strategy" (i.e. creates positive annual cash balances through implementation of the aforementioned itemized recommendations). -40% 29% #3-Assignment (Financial Modeling-Startup AB) Financial Statement Analysis Year 1 Year 2 Year 3 Year 4 Year 5 Gross Margin 48% 46% 43% 40% 37% EBITDA Margin -37% -11% 8% 11% 12% Pre-Tax Margin -13% 7% 11% 12% Return on Equity N/A N/A 2046% 98% 62% Revenue/Sales Professional (VP Mktg + $1,500,000 $950,000 $1,350,000 $1,517,857 $1,777,778 Gross Profit/Sales Professional (VP Mktg $750,000 $480,000 $648,000 $693,571 $773,333 Revenue/Employee $312,000 $393,750 $627,500 $710.882 $850,909 Customers/Salesperson Revenue/Customer Marketing & Sales/Total Operating Exp. 15% 21% 31% 38% Product Development/Total Oper. Exp. 13% 3% 2% 1% 1% Non-Payroll Expenses/Total Oper. Exp. 52% 46% 50% 52% 57% Payroll Expenses/Total Oper. Exp. 48% 54% 50% 48% 43% Average Employee Salary plus Commiss $96,000 $91,250 $82,583 $74,294 $69,409 Current Ratio (Current Assets/Current Liab.) -0.3 -2.2 0.7 2.4 3.5 Quick Ratio (Cash + A/R/Current Liab.) -3.4 -5.6 -2.9 -1.3 -0.2 Long-Term Debt/Equity Ratio 0.0 0.0 0.0 0.0 0.0 Interest Coverage (EBITDA/Interest Expense, 0.0 0.0 0.0 0.0 0.0 Bank Debt/EBITDA 0.0 0.0 0.0 0.0 0.0 Operating Exp. Cash Coverage (mths) -2.8 -6.4 -5.8 -3.9 -1.8 Cash Runway (mths) -6.5 -32.5 N/A N/A N/A (Total Operating Exp. - Gross Profit) Cash Runway @ 50% Scenario (mths) -4.0 - 10.7 N/A N/A N/A (Total Operating Exp. - Gross Profit @ 50%) Revenue Growth Rate N/A 102% 139% 60% 55% SG&A Growth Rate N/A 34% 47% 33% 34% Footnotes: adequate gross profit contribution to cover their direct compensation (base salary + sales commissions + payroll taxes + employee benefits) AND contribute to the overall business operating expenses. Ideally, a salesperson at minimum should generate a 3X to 4X ratio, and obviously the higher the better. The VP Marketing/Sales is included because during startup phases they actually sell. 2) Ideally, if the revenue forecast is based upon an "bottoms-up" forecasting methodology, the number of customers will be known. Especially in recurring revenue models, salesperson frequently must continually revisit existing customers. Therefore, a practical ratio of customer per salesperson represents a variable that needs to be monitored. An incredibly efficient way to analyze the underlying staffing levels is to examine the "revenue/employee" ratio and compare to industry benchmarks. It absolutely requires employees to run a business, deliver the product/services, handle all corresponding administrative tasks, etc. Typically during the early phases of a startup business the revenue/employee will be below industry comparable but should rapidly approach and typically slightly exceed it as the business expands/matures. Additionally, the higher the product/service operating economies of scale the more rapid the potential increase. This is partially why Angels & Venture Capitalist prefer investing in early stage startups with potential strong operating leverage. Service companies typically fall in the $200,000 to $500,000 revenue per employee, whereas a more capital intensive businesses will range in the $600,000 to $1,000,00 revenue/employee as general rule of thumb". - ...-...------ absolutely required to support employees. Without the necessary tools, employees cannot effectively perform their jobs. Therefore, an excellent ratio to ensure an acceptable balance is being maintained within the financial projections is to examine the ratio of total non-payroll operating expense line items to total payroll costs. As a general rule, the ratio of Payroll Expenses to Non-Payroll expenses should never exceed 67%, however this target ratio can vary meaningfully by industry characteristics. and runway. Cash Coverage equals the number of months the business can operate without any revenues at its average monthly operating expense level. This is a worst case type of scenario. The Cash Runway equals the number of months the business can operate at its net average monthly cash "burn-rate", or average gross profits less operating expenses. This is more realistic approach. A minimum acceptable Cash Runway should probably be 3 months, as this is typically the minimum necessary time to raise incremental capital. A typical scenario is to modify the average monthly gross profits to a "50% reduction" in revenues. #3-Assignment (Financial Modeling-Startup AB) Proforma Cash Flow Statement Year 1 Year 2 Year 3 Year 4 Year 5 Net Income ($620,267) ($400,933) $534,380 $1,276,590 $2,164,693 Plus: Depreciation $36,667 $48,333 $70,000 $85,000 $111,667 Operating Cash Flow ($583,600) ($352,600) $604,380 $1,361,590 $2,276,360 Working Capital Requirements: Change in Accounts Receivables ($33,333) ($44,167) ($121,667) ($126,528) ($184,306) Change in Inventory ($200,000) ($270,000) ($783,333) ($886,667) ($1,356,667) Change in Accounts Payable $81,022 $73,875 $207,542 $233,580 $355,698 Change in Bank Credit Line $0 $0 $0 $0 $0 Subtotal Working Capital Requirement ($152,311) ($240,292) ($697,458) ($779,614) ($1,185,275) Investment Capital Requirements: Change in Equipment ($125,000) ($25,000) ($75,000) ($75,000) ($100,000) Change in Furniture & Equipment ($30,000) ($20,000) ($20,000) ($35,000) ($40,000) Subtotal Investment Capital Requirem ($155,000) ($45,000) ($95,000) ($110,000) ($140,000) Funding Sources: Change in Long-term Debt $0 $0 $0 $0 $0 Change in Equity $500,000 $0 $0 $0 $0 Tax Distribution-Members $0 $0 ($133,595) ($319,148) ($541,173) Subtotal Funding Sources $500,000 $0 ($133,595) ($319,148) ($541,173) Total Cash Flow ($390,911) ($637,892) ($321,673) $152,828 $409,912 Beginning Cash $75,000 ($315,911) ($953,803) ($1,275,476) ($1,122,647) Ending Cash ($315,911) ($953,803) ($1,275,476) ($1,122,647) ($712,735) Footnotes: constructed entirely from the Income Statement and net changes in the Balance Sheet. Therefore contrary to perception, the Cash Flow Statement is actually the easiest projected financial statement to compile, and yet ironically the most important. 2) The "Use of Funds" provided to investors ABSOLUTELY needs to be compared and/or reconciled against the Cash Flow Statement. The Cash Flow Statement clearly identifies the amount of internal cash consumed or generated, working capital demands of the business model, investment demands in longer term capital assets, cash contingency and the means by which these assets are funded (the sources). Beg. #3-Assignment (Financial Modeling-Startup AB) Proforma Balance Sheet Year 1 Year 2 Year 3 Year 4 Year 5 Cash $75,000 ($315,911) ($953,803) ($1,275,476) ($1,122,647) ($712,735) Accounts Receivables $10,000 $43,333 $87,500 $209, 167 $335,694 $520,000 Inventory $50,000 $250,000 $520,000 $1,303,333 $2,190,000 $3,546,667 Total Current Assets $135,000 ($22,578) ($346,303) $237,024 $1,403,047 $3,353,931 Equipment $0 $125,000 $150,000 $225,000 $300,000 $400,000 Office Furniture & Computers $5,000 $35,000 $55,000 $75,000 $110,000 $150,000 Accumulated Depreciation $0 ($36,667) ($85,000) ($ 155,000) ($240,000) ($351,667) Net PP&E $5,000 $123,333 $120,000 $145,000 $170,000 $198,333 Total Assets $140,000 $100,756 ($226,303) $382,024 $1,573,047 $3,552,265 Account Payable $0 $81,022 $154,897 $362,439 $596,020 $951,717 Bank Credit Line $0 $0 $0 $0 $0 $0 Total Current Liabilities $0 $81,022 $154,897 $362,439 $596,020 $951,717 Long-term Debt $0 $0 $0 $0 $0 $0 Total Liabilities $0 $81,022 $154,897 $362,439 $596,020 $951,717 Equity $150,000 $650,000 $650,000 $650,000 $650,000 $650,000 Retained Earnings ($10,000) ($630,267) ($1,031,200) ($496,820) $779,770 $2,944,463 Tax Distribution $0 $0 $0 ($133,595) ($452,743) ($993,916) Total Equity $140,000 $19,733 -$381,200 $19,585 $977,028 $2,600,548 Total Liabilities & Equity $140,000 $100,756 -$226,303 $382,024 $1,573,047 $3,552,265 Check Balance $0 $0 $0 $0 $0 $0 Footnotes: 1) If the company is a Limited Liability Corporation (LLC), the company is a "pass through" income tax entity, AND does not directly pay income taxes. However, since the individual equity owners of an LLC must pay income taxes on their pro-rata share (individual's % ownership x Pre-tax Income) an LLC will almost always make a cash distribution equal to the aggregate tax income obligation. Therefore, this transaction is only reflected within the Balance Sheet, and effectively is recorded as a equity capital account disbursement (herein line itemed as "Tax Distribution") and a corresponding reduction in cash. 2) ALWAYS maintain a "Check Balance" line item computation, so you will absolutely know your Balance Sheet is in balance. #3-Assignment (Financial Modeling-Startup AB) Proforma Income Statement Year 1 Year 2 Year 3 Year 4 Year 5 Revenues: Product A $1,500,000 $2,850,000 $6,750,000 $10,625,000 $16,000,000 Product B $0 $150,000 $400,000 $800,000 $1,600,000 Freight/Shipping Revenue $60,000 $150,000 $380,000 $660,000 $1,120,000 Total Revenues $1,560,000 $3,150,000 $7,530,000 $12,085,000 $18,720,000 Cost of Good Sold $750,000 $1,560,000 $3,910,000 $6,570,000 $10,640,000 Freight/Shipping Expenses $60,000 $150,000 $380,000 $660,000 $1,120,000 Sales Commissions $0 $0 $0 $0 $0 Gross Profit $750,000 $1,440,000 $3,240,000 $4,855,000 $6,960,000 Gross Profit Margin 48% 46% 43% 40% 37% Operating (Overhead) Expenses: Salaries $480,000 $730,000 $991,000 $1,263,000 $1,527,000 Employee Taxes & Benefits $153,600 $233,600 $317,120 $404,160 $488,640 Marketing Expenses $127,500 $155,000 $255,000 $305,000 $605,000 Advertising Expenses $75,000 $150,000 $357,500 $571,250 $880,000 Sales Travel $0 $72,000 $144,000 $216,000 $288,000 Product Development & Testing $175,000 $50,000 $50,000 $50,000 $50,000 Product Certification Expenses $0 $0 $0 $0 $0 Internet/Website Expenses $90,000 $125,000 $125,000 $125,000 $125,000 Travel Expenses $60,000 $60,000 $60,000 $60,000 $60,000 Telephone Expenses $37,500 $45,000 $65,750 $87,125 $118,000 Office Rent $47,500 $52,000 $58,000 $105,500 $113,000 Insurance Expenses $22,500 $45,000 $107,250 $171,375 $264,000 Accounting $35,000 $45,000 $55,000 $65,000 $75,000 Legal $30,000 $30,000 $50,000 $70,000 $90,000 Total Operating Expenses $1,333,600 $1,792,600 $2,635,620 $3,493,410 $4,683,640 EBITDA ($583,600) ($352,600) $604,380 $1,361,590 $2,276,360 -37% -11% 8% 11% 12% Depreciation $36,667 $48,333 $70,000 $85,000 $111,667 Interest Expense $0 $0 $0 $0 $0 Pre-Tax Income ($620,267) ($400,933) $534,380 $1,276,590 $2,164,693 EBT Profit Margin -40% -13% 7% 11% 12% Footnotes: 1) NO direct financial entries should be inserted within the Income Statement forecast. All listed financial figures MUST be computed from business assumptions contained on the Income Statement Assumption or Balance Sheet Assumptions spreadsheet tab. The forecasted figures on the Income Statement will represent a blend of variable, fixed, and semi-fixed computations against projected business volumes. 2) If multiple meaningful products/services are anticipated, it is recommended to highlight by line iteming each, provided it does not it does not exceed four. majority of the Cost of Goods Sold (COGS) or Cost of Sales (COS) line should be variable expenses and therefore move proportionately with changes/modifications in the unit sales/revenue line. It is recommended the COGS/COS line be computed using an estimated unit cost NOT as a direct percentage of revenues, since the sales price point can change over time as well as the unit cost should decline as economies of scale increase. While it can be included within the COGS/COS, as done herein, a variable Sales Commission also be included in the SG&A or Operating Expenses. 4) ALWAYS compute a EBITDA (Earnings Before Income Taxes Depreciation & Amortization) line as this represents the free cash flow internally generated or consumptions within the defined time period. #3-Assignment (Financial Modeling-Startup AB) Balance Sheet Assumptions Beginning Balance Sheet: Beg Year 1 Year 2 Year 3 Year 4 Year 5 Balances at Time/Year 0 Cash $75,000 Accounts Receivables $10,000 Inventory $50,000 Leasehold Improvements $0 Office Furniture & Computers $5,000 Accumulated Depreciation $0 Account Payable $0 Bank Credit Line $0 Long-term Debt $0 Equity $150,000 Retained Earnings ($10,000) Tax Distribution $0 Check Figure $0 Average # Days in Accts. Rec. 10 Average # Days in Inventory-Finished 120 Average # Days in COGS Accts. Payable 30 Average # Days in Operating Expenses Payable 5 Capital Expenditures: Equipment - Warehouse $125,000 $25,000 $75,000 $75,000 $100,000 Equipment Depreciation Schedule (in yrs.) 5 Office Equipment $30,000 $20,000 $20,000 $35,000 $40,000 Office Furniture & Computers Depr. Sch. (in yrs.) 3 Bank Credit Line: Advance Ratio for Accts. Rec. 0% Advance Ratio for Inventory-Finished 0% Interest Rate 0.0% Equity Capital Raised $500,000 $0 $0 $0 $0 Incremental Member Tax Rate 25% Footnotes: 1) In order to compute the Cash Flow Statement, which predominantly reflects changes over time between two Balance Sheets, it is absolutely necessary to have a "Beginning" Balance Sheet. While this can be included on the Balance Sheet spreadsheet tab, recommend including it within the Balance Sheet Assumptions given that the Beginning Balance Sheet is frequently a near-term forecast and therefore essentially an assumption. 2) Fundamentally within the Balance Sheet there are assumptions that remain relative constant or fixed (such as A/R days, etc.) over the entire horizon and those that must absolutely be reflected within a definitive time period (such as capital fundings/repayments, capital purchases, etc.). 1.0 #3-Assignment (Financial Modeling-Startup AB) Income Statement Assumptions Unit Sales/Revenue Assumptions: Year 1 Year 2 Year 3 Year 4 Year 5 Product A Units Sold 15,000 30,000 75,000 125,000 200,000 Unit Price $100.00 $95.00 $90.00 $85.00 $80.00 Unit A COGS (Outsourced Mfg.) $50.00 $50.00 $50.00 $50.00 *30.00 $50.00 Product B Units Sold 0 7,500 20,000 40,000 80,000 Unit Price $0.00 $20.00 $20.00 $20.00 $20.00 Unit COGS $0.00 $8.00 $8.00 $8.00 $8.00 Unit Shipping Paid By Customer $4.00 $4.00 $4.00 $4.00 $4.00 Unit Shipping Costs To Deliver $4.00 $4.00 $4.00 $4.00 $4.00 Staffing Plan/Compensation Assumptions: Year 1 Year 2 Year 3 Year 4 Year 5 Annual Comp. President $150,000 1.0 1.0 1.0 1.0 VP Sales & Marketing $120,000 1.0 1.0 1.0 1.0 1.0 Shipping Clerks (1:50,000 units) $36,000 1.0 1.0 2.0 4.0 6.0 Sales Professionals $75,000 2.0 4.0 6.0 8.0 CFO/Controller $100,000 1.0 1.0 1.0 1.0 Accountants (1:200,000 units) $42,000 1.0 1.0 1.0 1.0 2.0 VP Engineering & Operations $132,000 1.0 1.0 1.0 1.0 1.0 IT Manager $75,000 1.0 1.0 1.0 HR Manager $50,000 1.0 1.0 Total # Employees 5.0 8.0 12.0 17.0 22.0 Sales Commission 0.0% Employee Taxes & Benefits 32% Annual Cost of Living Adjustments 0.0% Marketing and SG&A Expense Assumptions: Year 1 Year 2 Year 3 Year 4 Year 5 Sales & Marketing Expenses: # National Trade Shows 3 6 6 6 6 Cost per Trade Show $17,500 Marketing Materials $75,000 $50,000 $150,000 $200,000 $500,000 Advertising Exp. (% Sales) 5.0% 5.0% 5.0% 5.0% 5.0% Travel Expense/Trade Show $0 Monthly Travel Expense/Sales Prof. $3,000 Development Expenses: Product Development & Testing $175,000 $50,000 $50,000 $50,000 $50,000 Regulatory Requirements $0 $0 $0 $0 $0 Web Development & Hosting $90,000 $125,000 $125,000 $125,000 $125,000 General & Administrative Expenses: Travel Expense/Executive/Month $2,500 Annual Telephone-Base 800 Service $30,000 Telephone-Variable 0.5% Warehouse Rent/Year $40,000 $40,000 $40,000 $80,000 $80,000 Office Rent/Employee $1,500 Insurance-General (% Rev.) 0.5% Insurance-Product Liability (% Rev.) 1.0% Outside Accounting $35,000 $45,000 $55,000 $65,000 $75,000 Outside Legal $30,000 $30,000 $50,000 $70,000 $90,000 Footnotes: 1) Typically, the necessary assumptions to build a forecasted Income Statement are segregated into a "revenue buildup" section, a Cost of Goods Sold (COGS) or Cost of Sales (COS) build up section, an employee "staffing plan", and SG&A or Operating Expense line item related. The underlying baseline assumptions will be a blend of variable, fixed, and semi-fixed factors. 2) Employee compensation predominantly is a major proportion of total expenses, therefore a detailed staffing plan which includes salaries, payroll taxes, commissions, bonus plans, benefits, etc. is a mandatory requirement. Within the staffing plan employee headcounts will range from fixed (executives), to variable (direct production), and semi-variable (sales personnel). 3) SG&A or Operating Expenses will absolutely range from fixed to variable and semi-fixed in between. The Financial Modeling needs to effectively model all the aforementioned. #3-Assignment (Capital Funding Strategy) Financial Model: #3-Assignment (Financial Modeling-Startup AB) Due: February 7th @ 11:59 pm Points: 50 Submit: Canvas #3-Assignment Startup AB: After completing the last #2-Assignment (Financial Modeling Projections), a fully completed Integrated Financial Model-Startup AB has been constructed based upon the Co-Founder's initial business decisions and plans for the Startup. Based upon these previously stated set of Income Statement & Balance Sheet input assumptions, Startup AB has a "negative" cash balance for Years 1 thru 5, which is unacceptable. Obviously, Startup AB CANNOT operate as a viable business with a negative cash balance. Therefore, the executive management team must thoughtfully modify several of the adjustable or manageable" business input assumptions within either the Income Statement Assumptions and/or Balance Sheet Assumptions until creating sufficient (i.e. adequate cash liquidity) positive Cash Balances across ALL five years. No single input assumption in either the Income Statement Assumptions tab or Balance Sheet Assumptions tab (i.e. remember do NOT adjust financial values within the Income Statement, Balance Sheet or Cash Flow Statement tabs), can be modified by more than +/- 25%, except for the Year 1 Equity Capital investment which is subject to a +/- $450,000 aggregate adjustment limit. However, any required incremental aggregate Equity Capital investment Assumptions amount after Year 1 has no percentage, since currently all input amounts are zero, or aggregate amount adjustment limitations. The focus on this "Capital Funding Strategy" needs to be on items or input business variables/assumptions that can reasonably be controlled or independently influenced by the executive management team. For example, it is not realistic or reasonable to assume that the current forecasted & negotiated Unit Price from the external manufacturer can be dramatically lowered or discounted, or that the large Year 1 Product Development Expenses can be dramatically cut/reduced and the Startup still be able to introduce Product A in Year 2 on time UNLESS the introduction timeframe is also proportionately pushed back. The offsetting ramifications of any modification or adjustment to the input business assumptions must be considered. In a Word document, prepare a prioritized list of recommendations and your supporting rationale or justification for each recommended modification to the corresponding Input Assumption for the executive management team. The supporting justification for each recommendation should not exceed a short paragraph. Each recommended Input Assumption modification must then be entered into the #3-Assignment (Financial Modeling-Startup AB). HIGHLIGHT ALL MODIFIED CELLS within this #3- Assigment (Financial Modeling-Startup AB) in Yellow. Remember that the cumulative impact from implementing ALL your recommendations must be the creation of a viable financial capital strategy (i.e. a sufficient annual positive cash liquidity balance throughout all five years). Submit these two documents/files cumulatively depicting and justifying an acceptable "Capital Funding Strategy" (i.e. creates positive annual cash balances through implementation of the aforementioned itemized recommendations). -40% 29% #3-Assignment (Financial Modeling-Startup AB) Financial Statement Analysis Year 1 Year 2 Year 3 Year 4 Year 5 Gross Margin 48% 46% 43% 40% 37% EBITDA Margin -37% -11% 8% 11% 12% Pre-Tax Margin -13% 7% 11% 12% Return on Equity N/A N/A 2046% 98% 62% Revenue/Sales Professional (VP Mktg + $1,500,000 $950,000 $1,350,000 $1,517,857 $1,777,778 Gross Profit/Sales Professional (VP Mktg $750,000 $480,000 $648,000 $693,571 $773,333 Revenue/Employee $312,000 $393,750 $627,500 $710.882 $850,909 Customers/Salesperson Revenue/Customer Marketing & Sales/Total Operating Exp. 15% 21% 31% 38% Product Development/Total Oper. Exp. 13% 3% 2% 1% 1% Non-Payroll Expenses/Total Oper. Exp. 52% 46% 50% 52% 57% Payroll Expenses/Total Oper. Exp. 48% 54% 50% 48% 43% Average Employee Salary plus Commiss $96,000 $91,250 $82,583 $74,294 $69,409 Current Ratio (Current Assets/Current Liab.) -0.3 -2.2 0.7 2.4 3.5 Quick Ratio (Cash + A/R/Current Liab.) -3.4 -5.6 -2.9 -1.3 -0.2 Long-Term Debt/Equity Ratio 0.0 0.0 0.0 0.0 0.0 Interest Coverage (EBITDA/Interest Expense, 0.0 0.0 0.0 0.0 0.0 Bank Debt/EBITDA 0.0 0.0 0.0 0.0 0.0 Operating Exp. Cash Coverage (mths) -2.8 -6.4 -5.8 -3.9 -1.8 Cash Runway (mths) -6.5 -32.5 N/A N/A N/A (Total Operating Exp. - Gross Profit) Cash Runway @ 50% Scenario (mths) -4.0 - 10.7 N/A N/A N/A (Total Operating Exp. - Gross Profit @ 50%) Revenue Growth Rate N/A 102% 139% 60% 55% SG&A Growth Rate N/A 34% 47% 33% 34% Footnotes: adequate gross profit contribution to cover their direct compensation (base salary + sales commissions + payroll taxes + employee benefits) AND contribute to the overall business operating expenses. Ideally, a salesperson at minimum should generate a 3X to 4X ratio, and obviously the higher the better. The VP Marketing/Sales is included because during startup phases they actually sell. 2) Ideally, if the revenue forecast is based upon an "bottoms-up" forecasting methodology, the number of customers will be known. Especially in recurring revenue models, salesperson frequently must continually revisit existing customers. Therefore, a practical ratio of customer per salesperson represents a variable that needs to be monitored. An incredibly efficient way to analyze the underlying staffing levels is to examine the "revenue/employee" ratio and compare to industry benchmarks. It absolutely requires employees to run a business, deliver the product/services, handle all corresponding administrative tasks, etc. Typically during the early phases of a startup business the revenue/employee will be below industry comparable but should rapidly approach and typically slightly exceed it as the business expands/matures. Additionally, the higher the product/service operating economies of scale the more rapid the potential increase. This is partially why Angels & Venture Capitalist prefer investing in early stage startups with potential strong operating leverage. Service companies typically fall in the $200,000 to $500,000 revenue per employee, whereas a more capital intensive businesses will range in the $600,000 to $1,000,00 revenue/employee as general rule of thumb". - ...-...------ absolutely required to support employees. Without the necessary tools, employees cannot effectively perform their jobs. Therefore, an excellent ratio to ensure an acceptable balance is being maintained within the financial projections is to examine the ratio of total non-payroll operating expense line items to total payroll costs. As a general rule, the ratio of Payroll Expenses to Non-Payroll expenses should never exceed 67%, however this target ratio can vary meaningfully by industry characteristics. and runway. Cash Coverage equals the number of months the business can operate without any revenues at its average monthly operating expense level. This is a worst case type of scenario. The Cash Runway equals the number of months the business can operate at its net average monthly cash "burn-rate", or average gross profits less operating expenses. This is more realistic approach. A minimum acceptable Cash Runway should probably be 3 months, as this is typically the minimum necessary time to raise incremental capital. A typical scenario is to modify the average monthly gross profits to a "50% reduction" in revenues. #3-Assignment (Financial Modeling-Startup AB) Proforma Cash Flow Statement Year 1 Year 2 Year 3 Year 4 Year 5 Net Income ($620,267) ($400,933) $534,380 $1,276,590 $2,164,693 Plus: Depreciation $36,667 $48,333 $70,000 $85,000 $111,667 Operating Cash Flow ($583,600) ($352,600) $604,380 $1,361,590 $2,276,360 Working Capital Requirements: Change in Accounts Receivables ($33,333) ($44,167) ($121,667) ($126,528) ($184,306) Change in Inventory ($200,000) ($270,000) ($783,333) ($886,667) ($1,356,667) Change in Accounts Payable $81,022 $73,875 $207,542 $233,580 $355,698 Change in Bank Credit Line $0 $0 $0 $0 $0 Subtotal Working Capital Requirement ($152,311) ($240,292) ($697,458) ($779,614) ($1,185,275) Investment Capital Requirements: Change in Equipment ($125,000) ($25,000) ($75,000) ($75,000) ($100,000) Change in Furniture & Equipment ($30,000) ($20,000) ($20,000) ($35,000) ($40,000) Subtotal Investment Capital Requirem ($155,000) ($45,000) ($95,000) ($110,000) ($140,000) Funding Sources: Change in Long-term Debt $0 $0 $0 $0 $0 Change in Equity $500,000 $0 $0 $0 $0 Tax Distribution-Members $0 $0 ($133,595) ($319,148) ($541,173) Subtotal Funding Sources $500,000 $0 ($133,595) ($319,148) ($541,173) Total Cash Flow ($390,911) ($637,892) ($321,673) $152,828 $409,912 Beginning Cash $75,000 ($315,911) ($953,803) ($1,275,476) ($1,122,647) Ending Cash ($315,911) ($953,803) ($1,275,476) ($1,122,647) ($712,735) Footnotes: constructed entirely from the Income Statement and net changes in the Balance Sheet. Therefore contrary to perception, the Cash Flow Statement is actually the easiest projected financial statement to compile, and yet ironically the most important. 2) The "Use of Funds" provided to investors ABSOLUTELY needs to be compared and/or reconciled against the Cash Flow Statement. The Cash Flow Statement clearly identifies the amount of internal cash consumed or generated, working capital demands of the business model, investment demands in longer term capital assets, cash contingency and the means by which these assets are funded (the sources). Beg. #3-Assignment (Financial Modeling-Startup AB) Proforma Balance Sheet Year 1 Year 2 Year 3 Year 4 Year 5 Cash $75,000 ($315,911) ($953,803) ($1,275,476) ($1,122,647) ($712,735) Accounts Receivables $10,000 $43,333 $87,500 $209, 167 $335,694 $520,000 Inventory $50,000 $250,000 $520,000 $1,303,333 $2,190,000 $3,546,667 Total Current Assets $135,000 ($22,578) ($346,303) $237,024 $1,403,047 $3,353,931 Equipment $0 $125,000 $150,000 $225,000 $300,000 $400,000 Office Furniture & Computers $5,000 $35,000 $55,000 $75,000 $110,000 $150,000 Accumulated Depreciation $0 ($36,667) ($85,000) ($ 155,000) ($240,000) ($351,667) Net PP&E $5,000 $123,333 $120,000 $145,000 $170,000 $198,333 Total Assets $140,000 $100,756 ($226,303) $382,024 $1,573,047 $3,552,265 Account Payable $0 $81,022 $154,897 $362,439 $596,020 $951,717 Bank Credit Line $0 $0 $0 $0 $0 $0 Total Current Liabilities $0 $81,022 $154,897 $362,439 $596,020 $951,717 Long-term Debt $0 $0 $0 $0 $0 $0 Total Liabilities $0 $81,022 $154,897 $362,439 $596,020 $951,717 Equity $150,000 $650,000 $650,000 $650,000 $650,000 $650,000 Retained Earnings ($10,000) ($630,267) ($1,031,200) ($496,820) $779,770 $2,944,463 Tax Distribution $0 $0 $0 ($133,595) ($452,743) ($993,916) Total Equity $140,000 $19,733 -$381,200 $19,585 $977,028 $2,600,548 Total Liabilities & Equity $140,000 $100,756 -$226,303 $382,024 $1,573,047 $3,552,265 Check Balance $0 $0 $0 $0 $0 $0 Footnotes: 1) If the company is a Limited Liability Corporation (LLC), the company is a "pass through" income tax entity, AND does not directly pay income taxes. However, since the individual equity owners of an LLC must pay income taxes on their pro-rata share (individual's % ownership x Pre-tax Income) an LLC will almost always make a cash distribution equal to the aggregate tax income obligation. Therefore, this transaction is only reflected within the Balance Sheet, and effectively is recorded as a equity capital account disbursement (herein line itemed as "Tax Distribution") and a corresponding reduction in cash. 2) ALWAYS maintain a "Check Balance" line item computation, so you will absolutely know your Balance Sheet is in balance. #3-Assignment (Financial Modeling-Startup AB) Proforma Income Statement Year 1 Year 2 Year 3 Year 4 Year 5 Revenues: Product A $1,500,000 $2,850,000 $6,750,000 $10,625,000 $16,000,000 Product B $0 $150,000 $400,000 $800,000 $1,600,000 Freight/Shipping Revenue $60,000 $150,000 $380,000 $660,000 $1,120,000 Total Revenues $1,560,000 $3,150,000 $7,530,000 $12,085,000 $18,720,000 Cost of Good Sold $750,000 $1,560,000 $3,910,000 $6,570,000 $10,640,000 Freight/Shipping Expenses $60,000 $150,000 $380,000 $660,000 $1,120,000 Sales Commissions $0 $0 $0 $0 $0 Gross Profit $750,000 $1,440,000 $3,240,000 $4,855,000 $6,960,000 Gross Profit Margin 48% 46% 43% 40% 37% Operating (Overhead) Expenses: Salaries $480,000 $730,000 $991,000 $1,263,000 $1,527,000 Employee Taxes & Benefits $153,600 $233,600 $317,120 $404,160 $488,640 Marketing Expenses $127,500 $155,000 $255,000 $305,000 $605,000 Advertising Expenses $75,000 $150,000 $357,500 $571,250 $880,000 Sales Travel $0 $72,000 $144,000 $216,000 $288,000 Product Development & Testing $175,000 $50,000 $50,000 $50,000 $50,000 Product Certification Expenses $0 $0 $0 $0 $0 Internet/Website Expenses $90,000 $125,000 $125,000 $125,000 $125,000 Travel Expenses $60,000 $60,000 $60,000 $60,000 $60,000 Telephone Expenses $37,500 $45,000 $65,750 $87,125 $118,000 Office Rent $47,500 $52,000 $58,000 $105,500 $113,000 Insurance Expenses $22,500 $45,000 $107,250 $171,375 $264,000 Accounting $35,000 $45,000 $55,000 $65,000 $75,000 Legal $30,000 $30,000 $50,000 $70,000 $90,000 Total Operating Expenses $1,333,600 $1,792,600 $2,635,620 $3,493,410 $4,683,640 EBITDA ($583,600) ($352,600) $604,380 $1,361,590 $2,276,360 -37% -11% 8% 11% 12% Depreciation $36,667 $48,333 $70,000 $85,000 $111,667 Interest Expense $0 $0 $0 $0 $0 Pre-Tax Income ($620,267) ($400,933) $534,380 $1,276,590 $2,164,693 EBT Profit Margin -40% -13% 7% 11% 12% Footnotes: 1) NO direct financial entries should be inserted within the Income Statement forecast. All listed financial figures MUST be computed from business assumptions contained on the Income Statement Assumption or Balance Sheet Assumptions spreadsheet tab. The forecasted figures on the Income Statement will represent a blend of variable, fixed, and semi-fixed computations against projected business volumes. 2) If multiple meaningful products/services are anticipated, it is recommended to highlight by line iteming each, provided it does not it does not exceed four. majority of the Cost of Goods Sold (COGS) or Cost of Sales (COS) line should be variable expenses and therefore move proportionately with changes/modifications in the unit sales/revenue line. It is recommended the COGS/COS line be computed using an estimated unit cost NOT as a direct percentage of revenues, since the sales price point can change over time as well as the unit cost should decline as economies of scale increase. While it can be included within the COGS/COS, as done herein, a variable Sales Commission also be included in the SG&A or Operating Expenses. 4) ALWAYS compute a EBITDA (Earnings Before Income Taxes Depreciation & Amortization) line as this represents the free cash flow internally generated or consumptions within the defined time period. #3-Assignment (Financial Modeling-Startup AB) Balance Sheet Assumptions Beginning Balance Sheet: Beg Year 1 Year 2 Year 3 Year 4 Year 5 Balances at Time/Year 0 Cash $75,000 Accounts Receivables $10,000 Inventory $50,000 Leasehold Improvements $0 Office Furniture & Computers $5,000 Accumulated Depreciation $0 Account Payable $0 Bank Credit Line $0 Long-term Debt $0 Equity $150,000 Retained Earnings ($10,000) Tax Distribution $0 Check Figure $0 Average # Days in Accts. Rec. 10 Average # Days in Inventory-Finished 120 Average # Days in COGS Accts. Payable 30 Average # Days in Operating Expenses Payable 5 Capital Expenditures: Equipment - Warehouse $125,000 $25,000 $75,000 $75,000 $100,000 Equipment Depreciation Schedule (in yrs.) 5 Office Equipment $30,000 $20,000 $20,000 $35,000 $40,000 Office Furniture & Computers Depr. Sch. (in yrs.) 3 Bank Credit Line: Advance Ratio for Accts. Rec. 0% Advance Ratio for Inventory-Finished 0% Interest Rate 0.0% Equity Capital Raised $500,000 $0 $0 $0 $0 Incremental Member Tax Rate 25% Footnotes: 1) In order to compute the Cash Flow Statement, which predominantly reflects changes over time between two Balance Sheets, it is absolutely necessary to have a "Beginning" Balance Sheet. While this can be included on the Balance Sheet spreadsheet tab, recommend including it within the Balance Sheet Assumptions given that the Beginning Balance Sheet is frequently a near-term forecast and therefore essentially an assumption. 2) Fundamentally within the Balance Sheet there are assumptions that remain relative constant or fixed (such as A/R days, etc.) over the entire horizon and those that must absolutely be reflected within a definitive time period (such as capital fundings/repayments, capital purchases, etc.). 1.0 #3-Assignment (Financial Modeling-Startup AB) Income Statement Assumptions Unit Sales/Revenue Assumptions: Year 1 Year 2 Year 3 Year 4 Year 5 Product A Units Sold 15,000 30,000 75,000 125,000 200,000 Unit Price $100.00 $95.00 $90.00 $85.00 $80.00 Unit A COGS (Outsourced Mfg.) $50.00 $50.00 $50.00 $50.00 *30.00 $50.00 Product B Units Sold 0 7,500 20,000 40,000 80,000 Unit Price $0.00 $20.00 $20.00 $20.00 $20.00 Unit COGS $0.00 $8.00 $8.00 $8.00 $8.00 Unit Shipping Paid By Customer $4.00 $4.00 $4.00 $4.00 $4.00 Unit Shipping Costs To Deliver $4.00 $4.00 $4.00 $4.00 $4.00 Staffing Plan/Compensation Assumptions: Year 1 Year 2 Year 3 Year 4 Year 5 Annual Comp. President $150,000 1.0 1.0 1.0 1.0 VP Sales & Marketing $120,000 1.0 1.0 1.0 1.0 1.0 Shipping Clerks (1:50,000 units) $36,000 1.0 1.0 2.0 4.0 6.0 Sales Professionals $75,000 2.0 4.0 6.0 8.0 CFO/Controller $100,000 1.0 1.0 1.0 1.0 Accountants (1:200,000 units) $42,000 1.0 1.0 1.0 1.0 2.0 VP Engineering & Operations $132,000 1.0 1.0 1.0 1.0 1.0 IT Manager $75,000 1.0 1.0 1.0 HR Manager $50,000 1.0 1.0 Total # Employees 5.0 8.0 12.0 17.0 22.0 Sales Commission 0.0% Employee Taxes & Benefits 32% Annual Cost of Living Adjustments 0.0% Marketing and SG&A Expense Assumptions: Year 1 Year 2 Year 3 Year 4 Year 5 Sales & Marketing Expenses: # National Trade Shows 3 6 6 6 6 Cost per Trade Show $17,500 Marketing Materials $75,000 $50,000 $150,000 $200,000 $500,000 Advertising Exp. (% Sales) 5.0% 5.0% 5.0% 5.0% 5.0% Travel Expense/Trade Show $0 Monthly Travel Expense/Sales Prof. $3,000 Development Expenses: Product Development & Testing $175,000 $50,000 $50,000 $50,000 $50,000 Regulatory Requirements $0 $0 $0 $0 $0 Web Development & Hosting $90,000 $125,000 $125,000 $125,000 $125,000 General & Administrative Expenses: Travel Expense/Executive/Month $2,500 Annual Telephone-Base 800 Service $30,000 Telephone-Variable 0.5% Warehouse Rent/Year $40,000 $40,000 $40,000 $80,000 $80,000 Office Rent/Employee $1,500 Insurance-General (% Rev.) 0.5% Insurance-Product Liability (% Rev.) 1.0% Outside Accounting $35,000 $45,000 $55,000 $65,000 $75,000 Outside Legal $30,000 $30,000 $50,000 $70,000 $90,000 Footnotes: 1) Typically, the necessary assumptions to build a forecasted Income Statement are segregated into a "revenue buildup" section, a Cost of Goods Sold (COGS) or Cost of Sales (COS) build up section, an employee "staffing plan", and SG&A or Operating Expense line item related. The underlying baseline assumptions will be a blend of variable, fixed, and semi-fixed factors. 2) Employee compensation predominantly is a major proportion of total expenses, therefore a detailed staffing plan which includes salaries, payroll taxes, commissions, bonus plans, benefits, etc. is a mandatory requirement. Within the staffing plan employee headcounts will range from fixed (executives), to variable (direct production), and semi-variable (sales personnel). 3) SG&A or Operating Expenses will absolutely range from fixed to variable and semi-fixed in between. The Financial Modeling needs to effectively model all the aforementioned