

Question
First identify an option strategy that will make a profit in the given scenario, then you will build Excel models to draw the profit graph
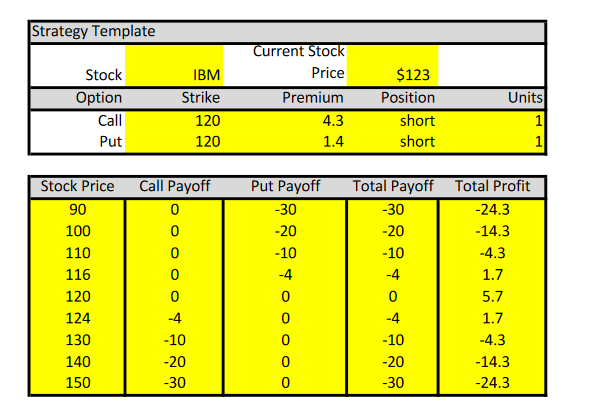
First identify an option strategy that will make a profit in the given scenario, then you will build Excel models to draw the profit graph for the option strategy. Scenario 1: you believe the price of a stock will stay around current level. a. Design an option strategy that will make a profit and fill out the Strategy Template (please refer to the example on next page). The strategy used in the example is a reverse straddle. Its not the only solution. You are encouraged to come up with a different strategy. You can find the price information from yahoo finance. b. Build Excel Model to draw the profit graph. Use Scatterplot function. Please play with the functions to make the chart look nice. c. Identify the price ranges between which the strategy will generate profit. What is your maximum gain? Maximum loss?
Ex:
Step by Step Solution
There are 3 Steps involved in it
Step: 1

Get Instant Access to Expert-Tailored Solutions
See step-by-step solutions with expert insights and AI powered tools for academic success
Step: 2

Step: 3
Ace Your Homework with AI
Get the answers you need in no time with our AI-driven, step-by-step assistance
Get Started
Investments Analysis And Management
Authors: Charles Jones, Nick Jones
11th Edition
0470477121, 9780470477120