Answered step by step
Verified Expert Solution
Question
1 Approved Answer
first photo is info that needs to be used the other photos are a example of the problem and how it should be done and
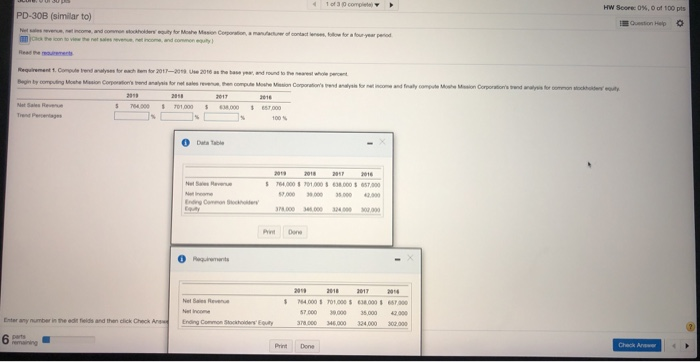
first photo is info that needs to be used
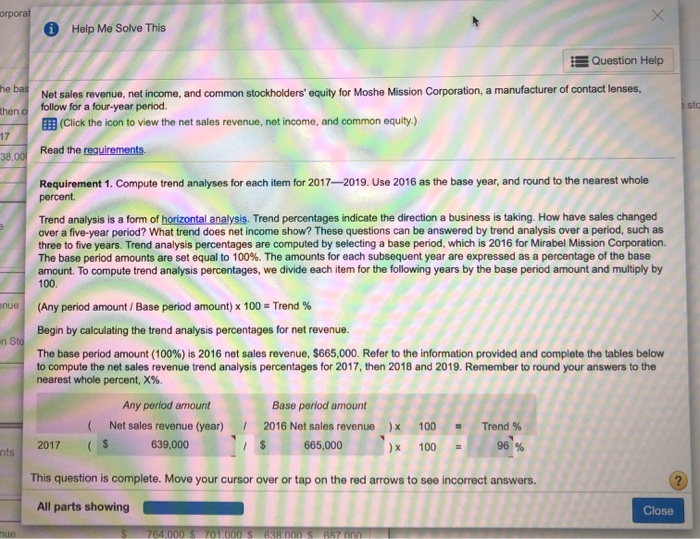
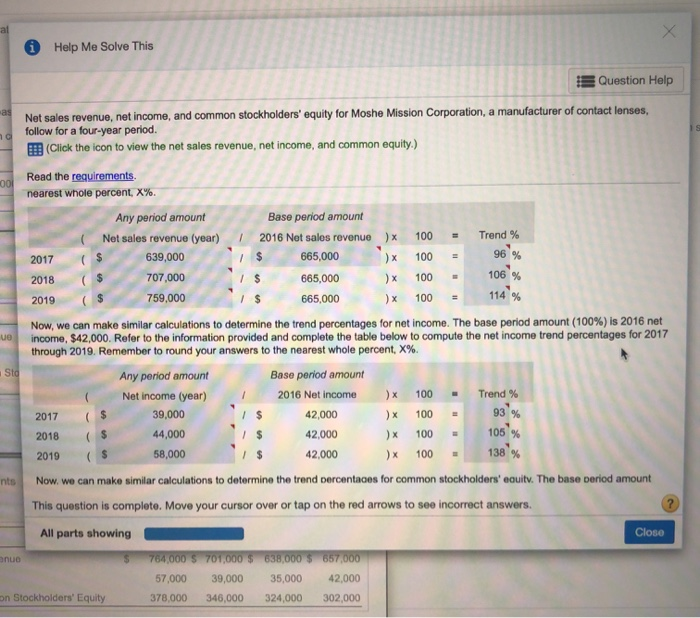
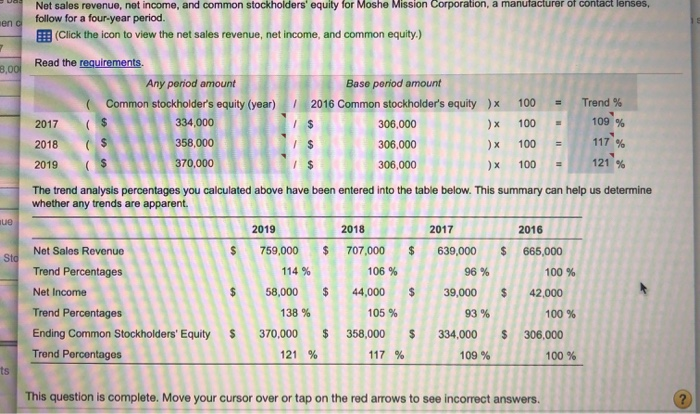
the other photos are a example of the problem and how it should be done and format the numbers are diffrent
photos are clear
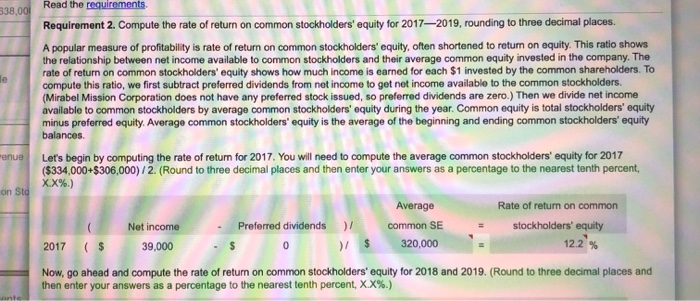
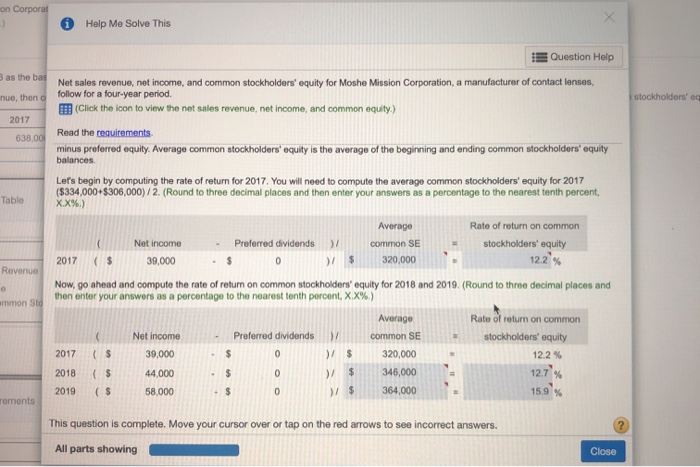
of com HW Score 0%, 0 of 100 pts PD-30B (similar to) Quone O Requirement comprend analyses for them for 2017-2018 2017 us the base and round the whole Begin by coming Mohesion Corporation end any formed a completes Corporated lyse for at home and final compute Mos Corporations and was forcy 2013 2017 5 754.00 1 T01000 5 100 S764.000 $70,000 $6.000 35.000 35.000 24 000 1 2017 164.000 0.000 $68.000 57 000 30,000 35.000 370.000 16.000 24.000 New Ending Commons Enter any number in the edit fields and then click Check And 423 302.000 6. Done corporal Help Me Solve This the bas Question Help Net sales revenue, net income, and common stockholders' equity for Moshe Mission Corporation, a manufacturer of contact lenses, follow for a four-year period. Click the icon to view the net sales revenue, net income, and common equity.) Read the requirements 1 st Khen a 17 38,00 enue Requirement 1. Compute trend analyses for each item for 20172019. Use 2016 as the base year, and round to the nearest whole percent Trend analysis is a form of horizontal analysis. Trend percentages indicate the direction a business is taking. How have sales changed over a five-year period? What trend does net income show? These questions can be answered by trend analysis over a period, such as three to five years. Trend analysis percentages are computed by selecting a base period, which is 2016 for Mirabel Mission Corporation. The base period amounts are set equal to 100%. The amounts for each subsequent year are expressed as a percentage of the base amount. To compute trend analysis percentages, we divide each item for the following years by the base period amount and multiply by 100 (Any period amount /Base period amount) x 100 = Trend % Begin by calculating the trend analysis percentages for net revenue. The base period amount (100%) is 2016 net sales revenue, $665,000. Refer to the information provided and complete the tables below to compute the net sales revenue trend analysis percentages for 2017, then 2018 and 2019. Remember to round your answers to the nearest whole percent, X%. Any period amount Base period amount (Net sales revenue (year) 1 2016 Net sales revenue) 100 Trend % ( $ 639,000 665,000 x 100 96 % n Sto 2017 nts This question is complete. Move your cursor over or tap on the red arrows to see incorrect answers, All parts showing Close nue 764.000 $701000 S 63.000 RST al x Help Me Solve This Question Help as na 001 ($ $ 96 % 106 % 114 % 2019 ue Net sales revenue, net income, and common stockholders' equity for Moshe Mission Corporation, a manufacturer of contact lenses, follow for a four-year period. (Click the icon to view the net sales revenue, net income, and common equity.) Read the requirements nearest Whole percent, X%. Any period amount Base period amount Net sales revenue (year) 2016 Net sales revenue 100 Trend % 2017 ($ 639,000 1 $ 665,000 ) x 100 2018 707,000 665,000 ) 100 759,000 665,000 ) x 100 Now, we can make similar calculations to determine the trend percentages for net income. The base period amount (100%) is 2016 net income, $42,000. Refer to the information provided and complete the table below to compute the net income trend percentages for 2017 through 2019. Remember to round your answers to the nearest whole percent, X%. Sto Any period amount Base period amount Net income (year) 2016 Net income ) 100 Trend % 39,000 42,000 100 2018 44,000 42,000 100 2019 58,000 42,000 ) 100 138% nts Now we can make similar calculations to determine the trend percentaces for common stockholders' equity. The base period amount This question is complete. Move your cursor over or tap on the red arrows to see incorrect answers. All parts showing Close 764,000 $ 701,000 $ 638,000 $ 657,000 57,000 39,000 35,000 42,000 on Stockholders' Equity 378,000 346,000 324,000 302,000 2017 93 % ($ 105 % anuo S en o 7 8,00 Net sales revenue, net income, and common stockholders' equity for Moshe Mission Corporation, a manufacturer of contact lenses, follow for a four-year period. Click the icon to view the net sales revenue, net income, and common equity.) Read the requirements Any period amount Base period amount (Common stockholder's equity (year) 2016 Common stockholder's equity )x 100 Trend % 2017 334,000 306,000 ) 100 2018 ( $ 358,000 306,000 ) 100 2019 ( $ 370,000 306,000 ) x 100 ($ 109 % 117 % 121 % The trend analysis percentages you calculated above have been entered into the table below. This summary can help us determine whether any trends are apparent. ue 2019 2018 2017 2016 Net Sales Revenue $ 759,000 $ 707,000 $ 639,000 $ Sto 665,000 100 % 106 % 96 % 114 % 58,000 $ $ 44,000 $ 39,000 $ Trend Percentages Net Income Trend Percentages Ending Common Stockholders' Equity s Trend Percentages 138 % 105 % 93 % 42.000 100 % 306.000 $ 358,000 $ 334.000 $ 370,000 121 % 117 % 109 % 100 % ts This question is complete. Move your cursor over or tap on the red arrows to see incorrect answers. 338,00 Read the requirements Requirement 2. Compute the rate of return on common stockholders' equity for 2017-2019, rounding to three decimal places. A popular measure of profitability is rate of return on common stockholders' equity, often shortened to return on equity. This ratio shows the relationship between net income available to common stockholders and their average common equity invested in the company. The rate of return on common stockholders' equity shows how much income is earned for each $1 invested by the common shareholders. To compute this ratio, we first subtract preferred dividends from net income to get net income available to the common stockholders. (Mirabel Mission Corporation does not have any preferred stock issued, so preferred dividends are zero) Then we divide net income available to common stockholders by average common stockholders' equity during the year. Common equity is total stockholders' equity minus preferred equity Average common stockholders' equity is the average of the beginning and ending common stockholders' equity balances Let's begin by computing the rate of return for 2017. You will need to compute the average common stockholders' equity for 2017 ($334,000+$306,000) / 2. (Round to three decimal places and then enter your answers as a percentage to the nearest tenth percent, XX%.) Average Rate of return on common Preferred dividends) common SE stockholders' equity 2017 ($ 39,000 0 320,000 12.2 % Now, go ahead and compute the rate of return on common stockholders' equity for 2018 and 2019. (Round to three decimal places and then enter your answers as a percentage to the nearest tenth percent, X.X%.) enue on Sto Net income )/ $ munte on Corporat X Help Me Solve This Question Help 3 as the bad nue, then stockholders' og 2017 638,00 Tablo Net sales revenue, net income, and common stockholders' equity for Moshe Mission Corporation, a manufacturer of contact lenses, follow for a four-year period. Click the icon to view the net sales revenue, net income, and common equity.) Read the requirements minus preferred equity. Average common stockholders' equity is the average of the beginning and ending common stockholders' equity balances Let's begin by computing the rate of return for 2017. You will need to compute the average common stockholders' equity for 2017 ($334,000+$306,000) / Z. (Round to three decimal places and then enter your answers as a percentage to the nearest tenth percent, X.X%) Average Rate of return on common Net income Preferred dividends >/ common SE stockholders' equity 2017 ($ 39,000 0 ) $ 320,000 12.2 % Now, go ahead and compute the rate of return on common stockholders' equity for 2018 and 2019. (Round to three decimal places and then enter your answers as a percentage to the nearest tenth porcent, XX%.) Average Rate return on common Net income Preferred dividends )/ common SE stockholders' equity 2017 (s 39,000 $ 0 )/ $ 320,000 122% 2018 ( $ 44,000 $ >/ $ 346,000 12.7 % 2019 ($ 58.000 $ )/ $ 364,000 Revenue ammon Sto 0 0 15,9 % remonts This question is complete, Move your cursor over or tap on the red arrows to see incorrect answers. All parts showing CloseStep by Step Solution
There are 3 Steps involved in it
Step: 1

Get Instant Access to Expert-Tailored Solutions
See step-by-step solutions with expert insights and AI powered tools for academic success
Step: 2

Step: 3

Ace Your Homework with AI
Get the answers you need in no time with our AI-driven, step-by-step assistance
Get Started


