

Answered step by step
Verified Expert Solution
Question
1 Approved Answer
first photo is info that needs to be used the other photos are a example of the problem and how it should be done and
first photo is info that needs to be used
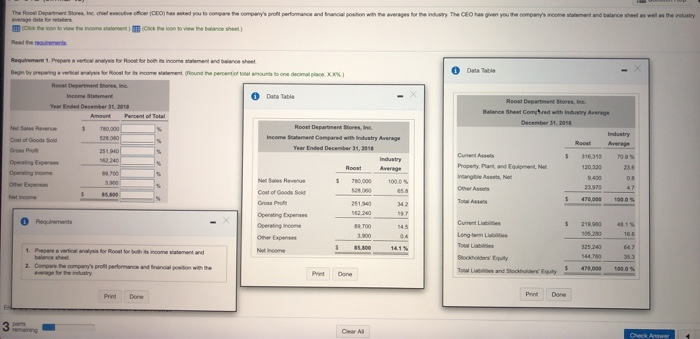
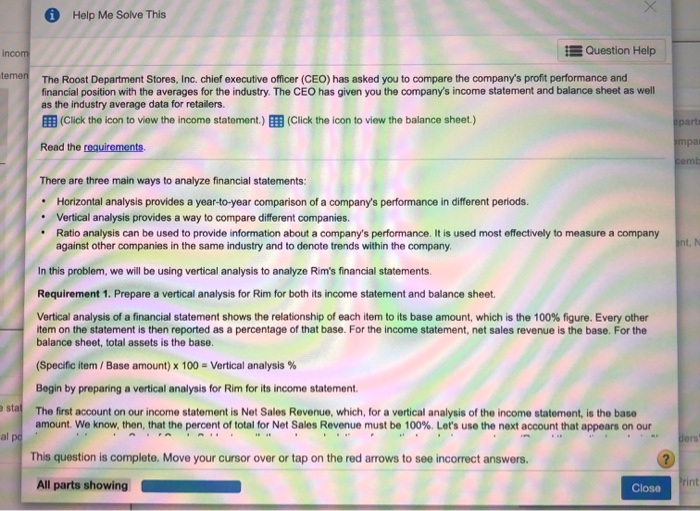
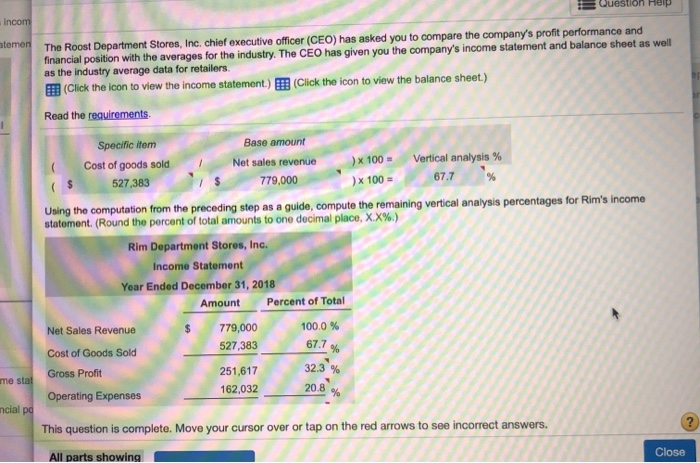
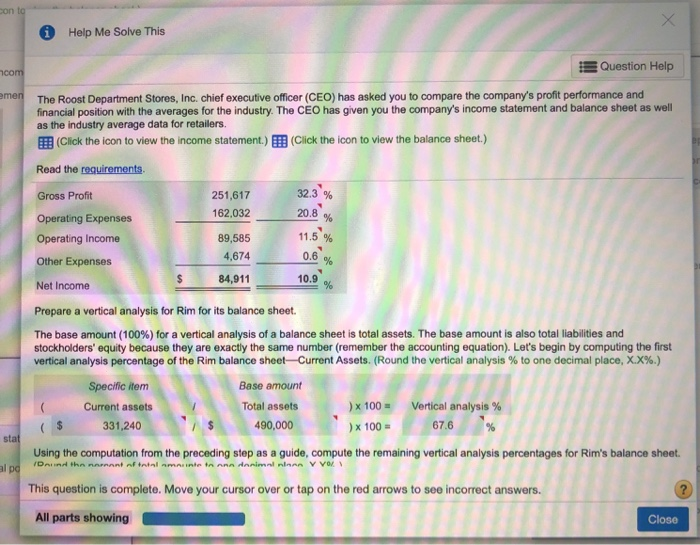
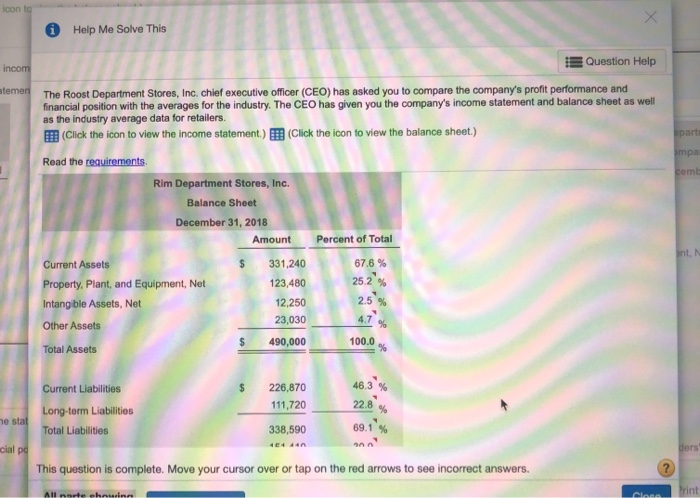
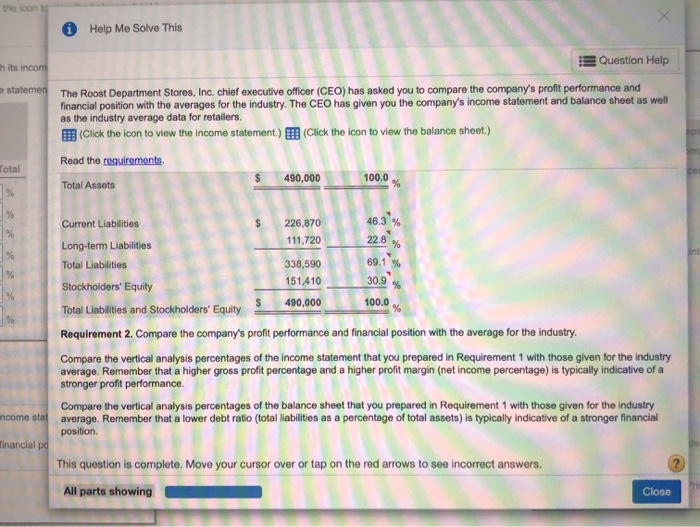
The Root Department Stores, in rivers and you to compare the company's profit performance and traci potion we te wees for renty The CEO has give you the company's income and balance as well as the industry sverage for Requirement 1. Preparatory two for both income statement and balance sheet Begin by preparing verticals troost to come toment round the percent of a note ore decimal pe XXX) Root Departments, the Income Statement Data Table Year Ended December 31, 2018 Percent of Total Na Sales Revenue $ 0.000 Hoont Department stores, in Cost of Good old 571,00 Income Statement compared with industry Average 251 010 Year Ended December 31, 2018 12.10 Industry Operating Roost Operating income 300 Others 3.000 Net Sales Revenue 1000 $ 35,000 Cost of Goods 342 Root Department stores, Inc. Balance Sheet Corred with industry Average December 31, 2018 Industry Roost 5 Curses Property and Equipment, 316 319 120,320 3,450 23.970 03 4 Other $ 470,000 Rements $ 210.900 Current Long-term 3.500 04 Operating income Open Not income 166 85.000 5 1. Pa vertically for Root for the comment and 141 325 240 564 67 2. Compare the company's profit performance and francia position with the $ 470.000 Tyland Stock Equity Print 100.0 % Done Print Done Print Done Clear A Help Me Solve This incom temen Question Help The Roost Department Stores, Inc. chief executive officer (CEO) has asked you to compare the company's profit performance and financial position with the averages for the industry. The CEO has given you the company's income statement and balance sheet as well as the industry average data for retailers. Click the icon to view the income statement.) Click the icon to view the balance sheet.) Read the requirements apart mpa come ant, N There are three main ways to analyze financial statements: Horizontal analysis provides a year-to-year comparison of a company's performance in different periods. Vertical analysis provides a way to compare different companies. Ratio analysis can be used to provide information about a company's performance. It is used most effectively to measure a company against other companies in the same industry and to denote trends within the company In this problem, we will be using vertical analysis to analyze Rim's financial statements. Requirement 1. Prepare a vertical analysis for Rim for both its income statement and balance sheet. Vertical analysis of a financial statement shows the relationship of each item to its base amount, which is the 100% figure. Every other item on the statement is then reported as a percentage of that base. For the income statement, net sales revenue is the base. For the balance sheet, total assets is the base. (Specific item / Base amount) x 100 = Vertical analysis % Begin by preparing a vertical analysis for Rim for its income statement The first account on our income statement is Net Sales Revenue, which, for a vertical analysis of the income statement, is the base amount. We know, then, that the percent of total for Net Sales Revenue must be 100%. Let's use the next account that appears on our stat al po dors This question is complete. Move your cursor over or tap on the red arrows to see incorrect answers. All parts showing Print Close Question Help incom atemen The Roost Department Stores, Inc. chief executive officer (CEO) has asked you to compare the company's profit performance and financial position with the averages for the industry. The CEO has given you the company's income statement and balance sheet as well as the industry average data for retailers. (Click the icon to view the income statement) (Click the icon to view the balance sheet.) Read the requirements ) x 100 = Specific item Base amount ( Cost of goods sold Net sales revenue ) x 100 Vertical analysis % ($ 527,383 779,000 67.7 Using the computation from the preceding step as a guide, compute the remaining vertical analysis percentages for Rim's income statement. (Round the percent of total amounts to one decimal place, XX%) Rim Department Stores, Inc. Income Statement Year Ended December 31, 2018 Amount Percent of Total Net Sales Revenue 779,000 100.0 % Cost of Goods Sold 527,383 Gross Profit 251,617 162,032 20.8 Operating Expenses $ 67.7 % 32.3 % me stat % ncial po This question is complete. Move your cursor over or tap on the red arrows to see incorrect answers. All parts showing Close con to Help Me Solve This com amen 32.3 % % % Question Help The Roost Department Stores, Inc. chief executive officer (CEO) has asked you to compare the company's profit performance and financial position with the averages for the industry. The CEO has given you the company's income statement and balance sheet as well as the industry average data for retailers. Click the icon to view the income statement.) (Click the icon to view the balance sheet.) Read the requirements Gross Profit 251,617 162,032 20.8 Operating Expenses Operating Income 89,585 11.5 % 4,674 0.6 Other Expenses 84,911 10.9 Net Income Prepare a vertical analysis for Rim for its balance sheet. The base amount (100%) for a vertical analysis of a balance sheet is total assets. The base amount is also total liabilities and stockholders' equity because they are exactly the same number (remember the accounting equation). Let's begin by computing the first vertical analysis percentage of the Rim balance sheet-Current Assets. (Round the vertical analysis % to one decimal place, X.X%.) Specific item Base amount Current assets Total assets ) x 100 = Vertical analysis % 331,240 490,000 ) x 100 = 67.6 Using the computation from the preceding step as a guide, compute the remaining vertical analysis percentages for Rim's balance sheet. ID In the meant of trial maintenan darimal mann v vo This question is complete. Move your cursor over or tap on the red arrows to see incorrect answers. All parts showing Close ( $ % stat al po icon to Help Me Solve This incom atemen part Question Help The Roost Department Stores, Inc. chief executive officer (CEO) has asked you to compare the company's profit performance and financial position with the averages for the industry. The CEO has given you the company's income statement and balance sheet as well as the industry average data for retailers. Click the icon to view the income statement.) Click the icon to view the balance sheet.) Read the requirements Rim Department Stores, Inc. Balance Sheet December 31, 2018 Amount Percent of Total impa cemi int, $ 331,240 67.6% 123,480 25.2 % 2.5 % Current Assets Property. Plant, and Equipment, Net Intangible Assets, Net Other Assets Total Assets 12,250 23,030 4.7 % 490,000 100.0 % $ Current Liabilities Long-term Liabilities Total Liabilities 226,870 111,720 46.3% 22.8 % he staf 338,590 69.1 % cial po ders This question is complete. Move your cursor over or tap on the red arrows to see incorrect answers. All mate housine the icon to 0 Help Me Solve This h its incom statemen Question Help The Roost Department Stores, Inc. chief executive officer (CEO) has asked you to compare the company's profit performance and financial position with the averages for the industry. The CEO has given you the company's income statement and balance sheet as well as the industry average data for retailers. Click the icon to view the income statement.) Click the icon to view the balance sheet.) Read the requirements Total Assets $ 490,000 Total 100.0 % % % 46.3% 226,870 111,720 22.8 % % Current Liabilities Long-term Liabilities Total Liabilities 338,590 69.1 % Stockholders' Equity 151.410 30.9 490,000 100.0 Total Liabilities and Stockholders' Equity Requirement 2. Compare the company's profit performance and financial position with the average for the industry. Compare the vertical analysis percentages of the income statement that you prepared in Requirement 1 with those given for the industry average. Remember that a higher gross profit percentage and a higher profit margin (net income percentage) is typically indicative of a stronger profit performance. Compare the vertical analysis percentages of the balance sheet that you prepared in Requirement 1 with those given for the industry ncome stat average. Remember that a lower debt ratio (total liabilities as a percentage of total assets) is typically indicative of a stronger financial position Tinancial pd This question is complete. Move your cursor over or tap on the red arrows to see incorrect answers. All parts showing Close the other photos are a example of the problem and how it should be done and format the numbers are diffrent
Step by Step Solution
There are 3 Steps involved in it
Step: 1

Get Instant Access to Expert-Tailored Solutions
See step-by-step solutions with expert insights and AI powered tools for academic success
Step: 2

Step: 3
Ace Your Homework with AI
Get the answers you need in no time with our AI-driven, step-by-step assistance
Get Started
Study Guide To Accompany Financial Accounting In An Economic Context
Authors: Jamie Pratt
6th Edition
0471731110, 978-0471731115