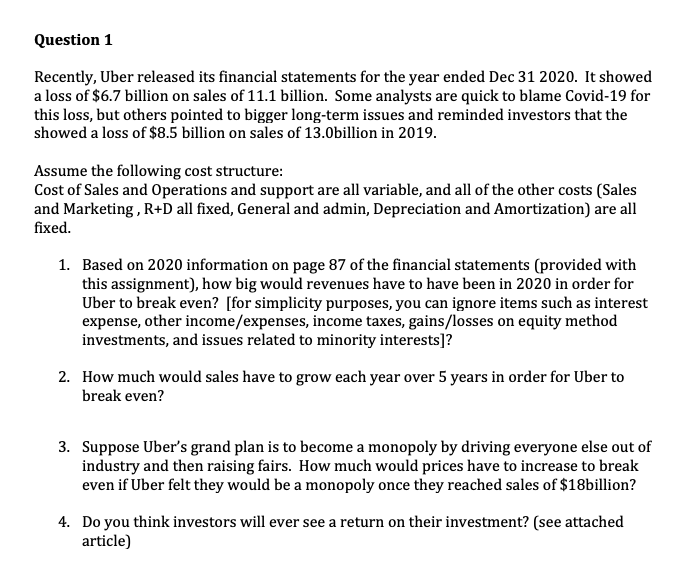
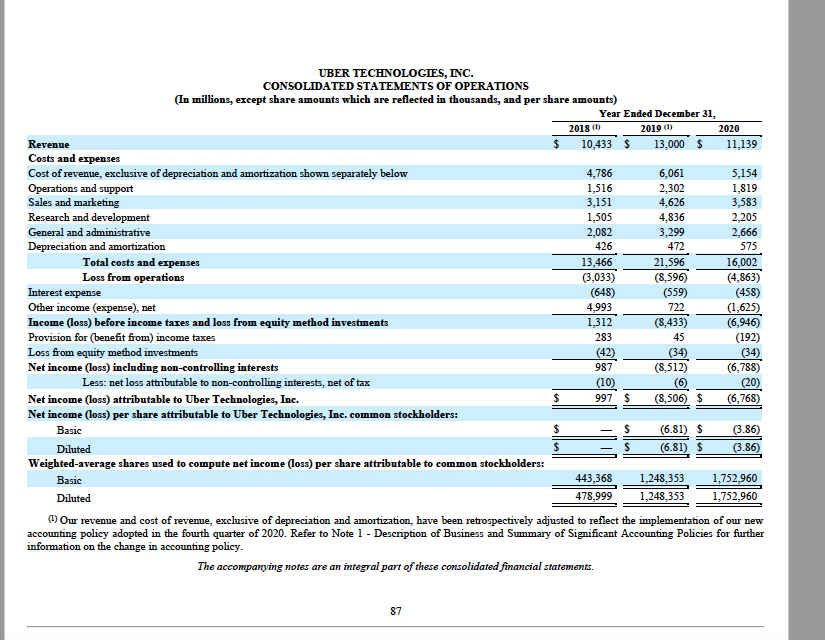
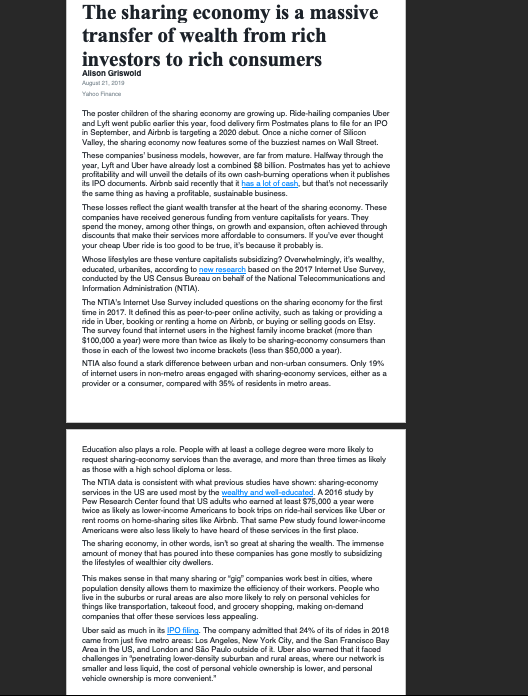
First photo is the main question, second photo is the uber 2020 statement and third photo is the article which is required for the part4 .


Question 1 Recently, Uber released its financial statements for the year ended Dec 31 2020. It showed a loss of $6.7 billion on sales of 11.1 billion. Some analysts are quick to blame Covid-19 for this loss, but others pointed to bigger long-term issues and reminded investors that the showed a loss of $8.5 billion on sales of 13.Obillion in 2019. Assume the following cost structure: Cost of Sales and Operations and support are all variable, and all of the other costs Sales and Marketing, R+D all fixed, General and admin, Depreciation and Amortization) are all fixed. 1. Based on 2020 information on page 87 of the financial statements (provided with this assignment), how big would revenues have to have been in 2020 in order for Uber to break even? [for simplicity purposes, you can ignore items such as interest expense, other income/expenses, income taxes, gains/losses on equity method investments, and issues related to minority interests]? 2. How much would sales have to grow each year over 5 years in order for Uber to break even? 3. Suppose Uber's grand plan is to become a monopoly by driving everyone else out of industry and then raising fairs. How much would prices have to increase to break even if Uber felt they would be a monopoly once they reached sales of $18billion? 4. Do you think investors will ever see a return on their investment? (see attached article) UBER TECHNOLOGIES, INC. CONSOLIDATED STATEMENTS OF OPERATIONS (In millions, except share amounts which are reflected in thousands, and per share amounts) Year Ended December 31, 2018 2019 (1) 2020 Revenue 10,433 $ 13,000 $ 11,139 Costs and expenses Cost of revenue, exclusive of depreciation and amortization shown separately below 4,786 6,061 5,154 Operations and support 1,516 2,302 1,819 Sales and marketing 3,151 4,626 3,583 Research and development 1,505 4,836 2,205 General and administrative 2,082 3,299 2,666 Depreciation and amortization 426 472 575 Total costs and expenses 13,466 21,596 16,002 Loss from operations (3,033) (8,596) (4,863) Interest expense (648) (559) (458) Other income (expense), net 4,993 722 (1,625) Income (loss) before income taxes and loss from equity method investments 1,312 (8,433) (6,946) Provision for (benefit from) income taxes 283 45 (192) Loss from equity method investments (42) (34) (34) Net income (loss) including non-controlling interests 987 (8,512) (6,788) Less: net loss attributable to non-controlling interests, net of tax (10) (6) (20) Net income (loss) attributable to Uber Technologies, Inc. $ 997 $ (8,506) $ (6,768) Net income (loss) per share attributable to Uber Technologies, Inc. common stockholders: Basic $ $ (6.81) $ (3.86) Diluted $ $ (6.81) $ (3.86) Weighted-average shares used to compute net income (loss) per share attributable to common stockholders: Basic 443,368 1,248,353 1,752,960 Diluted 478,999 1,248,353 1,752,960 Ow revenue and cost of revenue, exclusive of depreciation and amortization, have been retrospectively adjusted to reflect the implementation of our new accounting policy adopted in the fourth quarter of 2020. Refer to Note 1 - Description of Business and Summary of Significant Accounting Policies for further information on the change in accounting policy. The accompanying notes are an integral part of these consolidated financial statements. 87 The sharing economy is a massive transfer of wealth from rich investors to rich consumers Allson Griswold Aug 21.2019 Yahoo Finan The poster children of the sharing coonomy are growing up. Ride-hailing companies Uber and Lyft went public earlier this year, food delivery firm Postmates plans to file for an IPO in September, and Airbnb is targeting a 2020 dobut. Once a niche corner of Silicon Valley, the sharing economy now features some of the buzziest names on Wall Street. These companies' business models, however, are far from mature. Halfway through the yoar. Lyft and Uber have already lost a combined $8 bilion. Postmatas has yet to achieve profitability and will unveil the details of its own cash-burring operations when it publishes its IPO documents. Airbnb said recently that it has a lot of cash, but that's not necessarily the same thing as having a profitable, sustainable business. These losses reflect the giant wealth transfer at the heart of the sharing economy. These companies have received generous funding from venture capitalists for years. They spend the money, among other things, on growth and expansion, often achieved through discounts that make their services more affordable to consumers. If you've ever thought your cheap Uber ride is too good to be true, it's because it probably is. Whose lifestyles are these venture capitalists subsidizing? Overwhelmingly, it's wealthy. educated, urbanites, according to new research based on the 2017 Internet Use Survey conducted by the US Census Bureau on behalf of the National Telecommunications and Information Administration (NTIA). The NTIA's Internet Use Survey included questions on the sharing coonomy for the first time in 2017. It defined this as peer-to-peer online activity, such as taking or providing a ride in Uber, booking or renting a home on Airbnb, or buying or selling goods on Etsy. The survey found that internet users in the highest family income bracket (more than $100,000 a year) were more than twice as likely to be sharing economy consumers than those in each of the lowest two income brackets (less than $50,000 a year). NTIA also found a stark difference between urban and non-urban consumers. Only 19% of internet users in non-metro areas engaged with sharing.coonomy services, either as a provider or a consumer, compared with 35% of residents in motro areas. Education also plays a role. People with at least a college degree were more likely to request sharing-conomy services than the average, and more than three times as likely as those with a high school diploma or less. The NTIA data is consistent with what previous studies have shown: sharing-economy services in the US are used most by the wealthy and well-educated. A 2016 study by Pew Research Center found that US adults who earned at least $75,000 a year were twice as likely as lower income Americans to book trips on ride-hail services like Uber or rent rooms on home-sharing sites like Airbnb. That same Pew study found lower income Americans were also less likely to have heard of these services in the first place. The sharing economy, in other words, isn't so great at sharing the wealth. The immense amount of money that has poured into these companies has gone mostly to subsidizing the lifestyles of wealthier city dwellers. This makes sense in that many sharing or "gig companies work best in cities, where population density allows them to maximize the efficiency of their workers. People who live in the suburbs or rural areas are also more likely to rely on personal vehicles for things like transportation, takeout food, and grocery shopping, making on-demand companies that offer these services less appealing. Uber said as much in its IPO filing. The company admitted that 24% of its of rides in 2018 came from just five metro areas: Los Angeles, New York City, and the San Francisco Bay Area in the US, and London and So Paulo outside of it. Uber also warned that it faced challenges in "penetrating lower-density suburban and rural areas, where our network is smaller and less liquid, the cost of personal vehicle ownership is lower, and personal vehicle ownership is more convenient." Question 1 Recently, Uber released its financial statements for the year ended Dec 31 2020. It showed a loss of $6.7 billion on sales of 11.1 billion. Some analysts are quick to blame Covid-19 for this loss, but others pointed to bigger long-term issues and reminded investors that the showed a loss of $8.5 billion on sales of 13.Obillion in 2019. Assume the following cost structure: Cost of Sales and Operations and support are all variable, and all of the other costs Sales and Marketing, R+D all fixed, General and admin, Depreciation and Amortization) are all fixed. 1. Based on 2020 information on page 87 of the financial statements (provided with this assignment), how big would revenues have to have been in 2020 in order for Uber to break even? [for simplicity purposes, you can ignore items such as interest expense, other income/expenses, income taxes, gains/losses on equity method investments, and issues related to minority interests]? 2. How much would sales have to grow each year over 5 years in order for Uber to break even? 3. Suppose Uber's grand plan is to become a monopoly by driving everyone else out of industry and then raising fairs. How much would prices have to increase to break even if Uber felt they would be a monopoly once they reached sales of $18billion? 4. Do you think investors will ever see a return on their investment? (see attached article) UBER TECHNOLOGIES, INC. CONSOLIDATED STATEMENTS OF OPERATIONS (In millions, except share amounts which are reflected in thousands, and per share amounts) Year Ended December 31, 2018 2019 (1) 2020 Revenue 10,433 $ 13,000 $ 11,139 Costs and expenses Cost of revenue, exclusive of depreciation and amortization shown separately below 4,786 6,061 5,154 Operations and support 1,516 2,302 1,819 Sales and marketing 3,151 4,626 3,583 Research and development 1,505 4,836 2,205 General and administrative 2,082 3,299 2,666 Depreciation and amortization 426 472 575 Total costs and expenses 13,466 21,596 16,002 Loss from operations (3,033) (8,596) (4,863) Interest expense (648) (559) (458) Other income (expense), net 4,993 722 (1,625) Income (loss) before income taxes and loss from equity method investments 1,312 (8,433) (6,946) Provision for (benefit from) income taxes 283 45 (192) Loss from equity method investments (42) (34) (34) Net income (loss) including non-controlling interests 987 (8,512) (6,788) Less: net loss attributable to non-controlling interests, net of tax (10) (6) (20) Net income (loss) attributable to Uber Technologies, Inc. $ 997 $ (8,506) $ (6,768) Net income (loss) per share attributable to Uber Technologies, Inc. common stockholders: Basic $ $ (6.81) $ (3.86) Diluted $ $ (6.81) $ (3.86) Weighted-average shares used to compute net income (loss) per share attributable to common stockholders: Basic 443,368 1,248,353 1,752,960 Diluted 478,999 1,248,353 1,752,960 Ow revenue and cost of revenue, exclusive of depreciation and amortization, have been retrospectively adjusted to reflect the implementation of our new accounting policy adopted in the fourth quarter of 2020. Refer to Note 1 - Description of Business and Summary of Significant Accounting Policies for further information on the change in accounting policy. The accompanying notes are an integral part of these consolidated financial statements. 87 The sharing economy is a massive transfer of wealth from rich investors to rich consumers Allson Griswold Aug 21.2019 Yahoo Finan The poster children of the sharing coonomy are growing up. Ride-hailing companies Uber and Lyft went public earlier this year, food delivery firm Postmates plans to file for an IPO in September, and Airbnb is targeting a 2020 dobut. Once a niche corner of Silicon Valley, the sharing economy now features some of the buzziest names on Wall Street. These companies' business models, however, are far from mature. Halfway through the yoar. Lyft and Uber have already lost a combined $8 bilion. Postmatas has yet to achieve profitability and will unveil the details of its own cash-burring operations when it publishes its IPO documents. Airbnb said recently that it has a lot of cash, but that's not necessarily the same thing as having a profitable, sustainable business. These losses reflect the giant wealth transfer at the heart of the sharing economy. These companies have received generous funding from venture capitalists for years. They spend the money, among other things, on growth and expansion, often achieved through discounts that make their services more affordable to consumers. If you've ever thought your cheap Uber ride is too good to be true, it's because it probably is. Whose lifestyles are these venture capitalists subsidizing? Overwhelmingly, it's wealthy. educated, urbanites, according to new research based on the 2017 Internet Use Survey conducted by the US Census Bureau on behalf of the National Telecommunications and Information Administration (NTIA). The NTIA's Internet Use Survey included questions on the sharing coonomy for the first time in 2017. It defined this as peer-to-peer online activity, such as taking or providing a ride in Uber, booking or renting a home on Airbnb, or buying or selling goods on Etsy. The survey found that internet users in the highest family income bracket (more than $100,000 a year) were more than twice as likely to be sharing economy consumers than those in each of the lowest two income brackets (less than $50,000 a year). NTIA also found a stark difference between urban and non-urban consumers. Only 19% of internet users in non-metro areas engaged with sharing.coonomy services, either as a provider or a consumer, compared with 35% of residents in motro areas. Education also plays a role. People with at least a college degree were more likely to request sharing-conomy services than the average, and more than three times as likely as those with a high school diploma or less. The NTIA data is consistent with what previous studies have shown: sharing-economy services in the US are used most by the wealthy and well-educated. A 2016 study by Pew Research Center found that US adults who earned at least $75,000 a year were twice as likely as lower income Americans to book trips on ride-hail services like Uber or rent rooms on home-sharing sites like Airbnb. That same Pew study found lower income Americans were also less likely to have heard of these services in the first place. The sharing economy, in other words, isn't so great at sharing the wealth. The immense amount of money that has poured into these companies has gone mostly to subsidizing the lifestyles of wealthier city dwellers. This makes sense in that many sharing or "gig companies work best in cities, where population density allows them to maximize the efficiency of their workers. People who live in the suburbs or rural areas are also more likely to rely on personal vehicles for things like transportation, takeout food, and grocery shopping, making on-demand companies that offer these services less appealing. Uber said as much in its IPO filing. The company admitted that 24% of its of rides in 2018 came from just five metro areas: Los Angeles, New York City, and the San Francisco Bay Area in the US, and London and So Paulo outside of it. Uber also warned that it faced challenges in "penetrating lower-density suburban and rural areas, where our network is smaller and less liquid, the cost of personal vehicle ownership is lower, and personal vehicle ownership is more convenient


