

Answered step by step
Verified Expert Solution
Question
1 Approved Answer
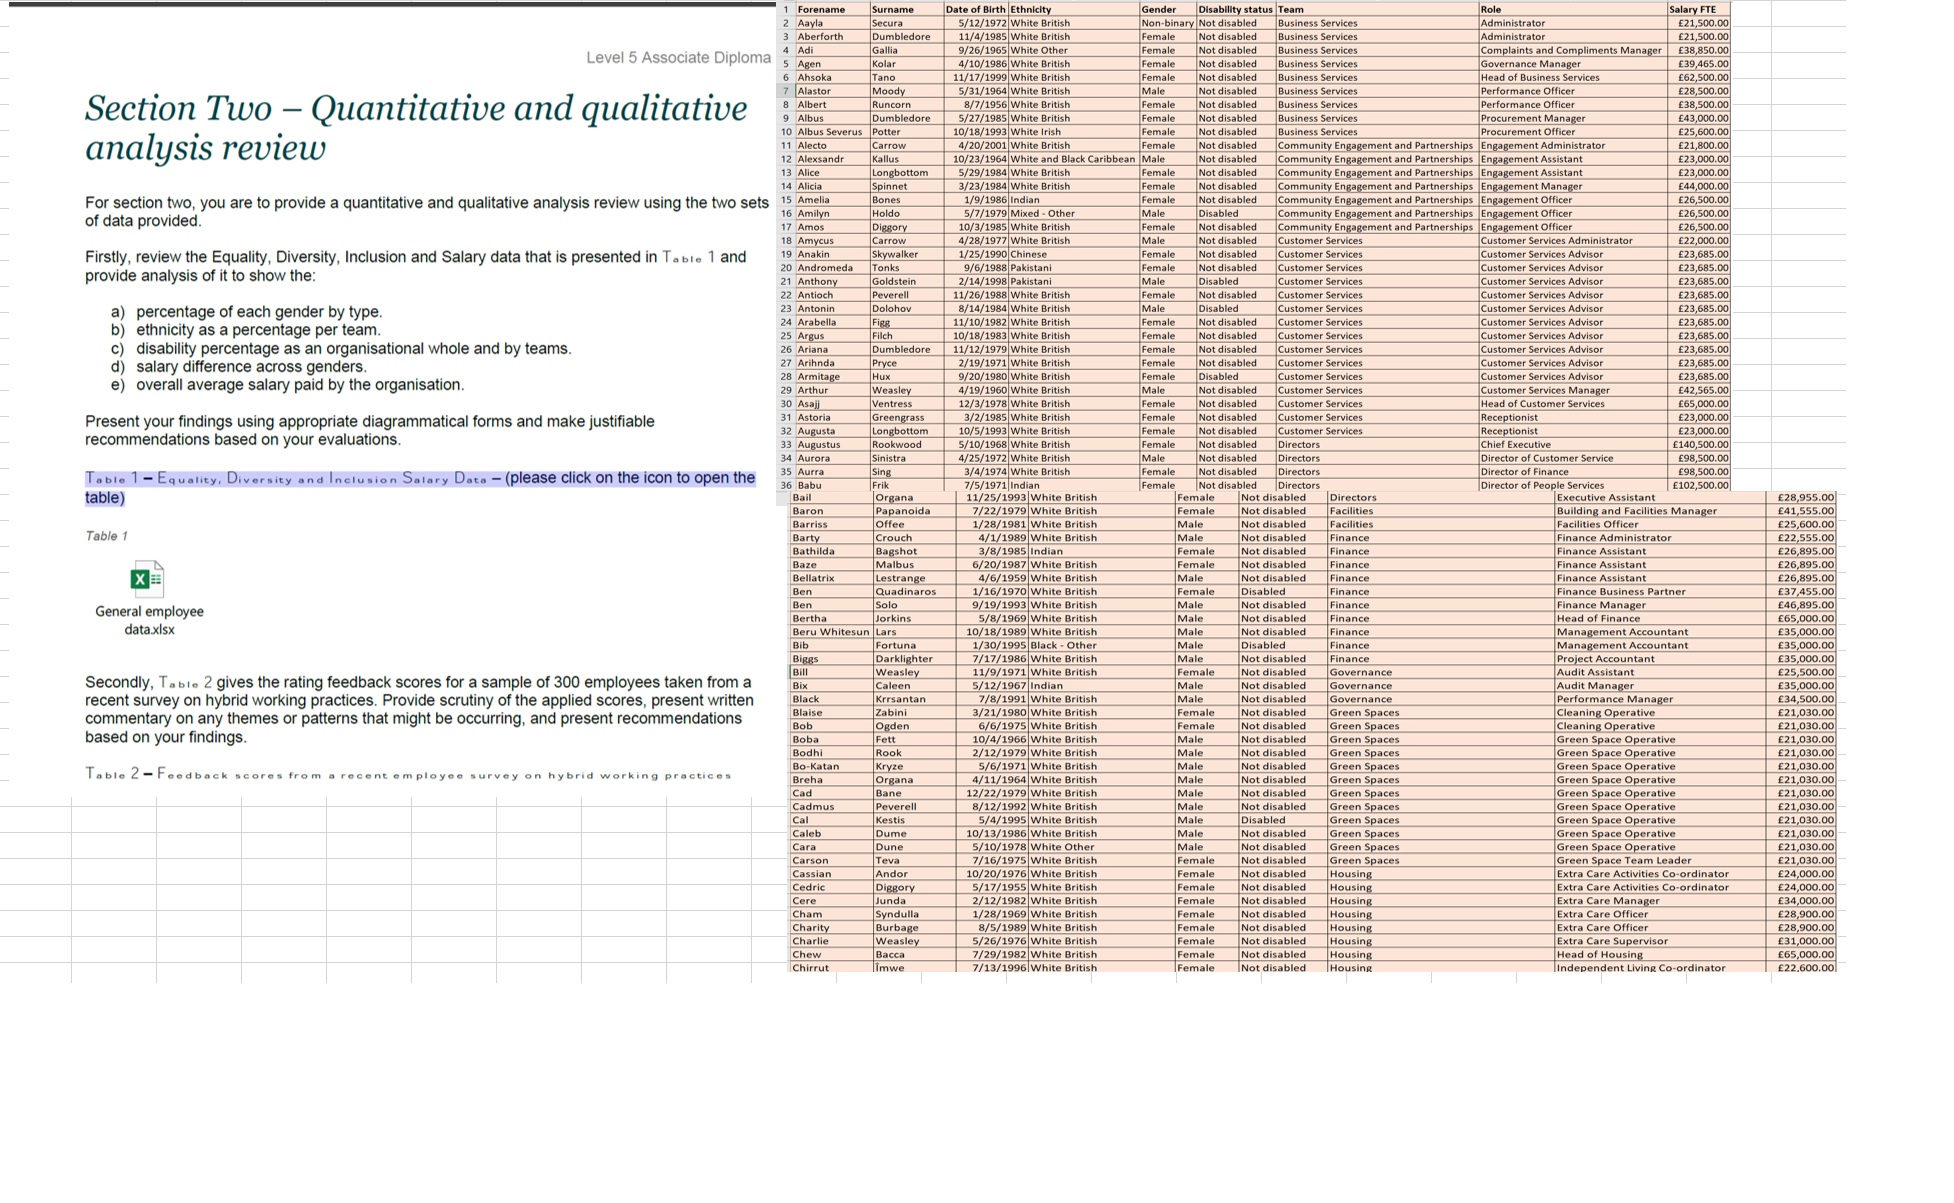
Firstly, review the Equality, Diversity, Inclusion and Salary data that is presented in Table 1 and provide analysis of it to show the: a )
Firstly, review the Equality, Diversity, Inclusion and Salary data that is presented in Table and
provide analysis of it to show the:
a percentage of each gender by type.
b ethnicity as a percentage per team.
c disability percentage as an organisational whole and by teams.
d salary difference across genders.
e overall average salary paid by the organisation.
Present your findings using appropriate diagrammatical forms and make justifiable
recommendations based on your evaluations.
Step by Step Solution
There are 3 Steps involved in it
Step: 1

Get Instant Access to Expert-Tailored Solutions
See step-by-step solutions with expert insights and AI powered tools for academic success
Step: 2

Step: 3
Ace Your Homework with AI
Get the answers you need in no time with our AI-driven, step-by-step assistance
Get Started
Managing Information Technology
Authors: Carol Brown, Daniel DeHayes, Jeffrey Hoffer, Wainright Marti
7th Edition
132146320, 978-0132146326