

Answered step by step
Verified Expert Solution
Question
1 Approved Answer
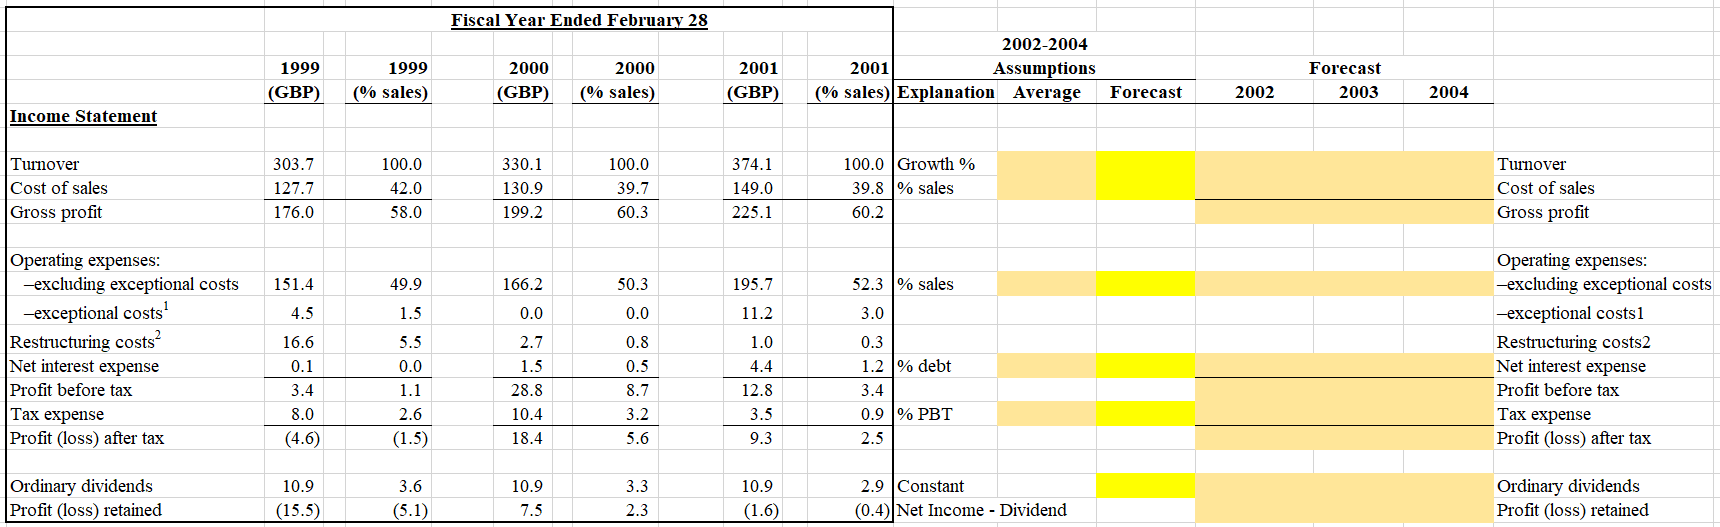
Fiscal Year Ended February 28 1999 (GBP) 1999 (% sales) 2000 (GBP) 2000 (% sales) 2001 (GBP) 2002-2004 2001 Assumptions (% sales) Explanation Average Forecast
Step by Step Solution
There are 3 Steps involved in it
Step: 1

Get Instant Access to Expert-Tailored Solutions
See step-by-step solutions with expert insights and AI powered tools for academic success
Step: 2

Step: 3
Ace Your Homework with AI
Get the answers you need in no time with our AI-driven, step-by-step assistance
Get Started
Misunderstanding Financial Crises Why We Donot See Them Coming
Authors: Gary B. Gorton
1st Edition
019992290X, 0199986886, 9780199922901, 9780199986880