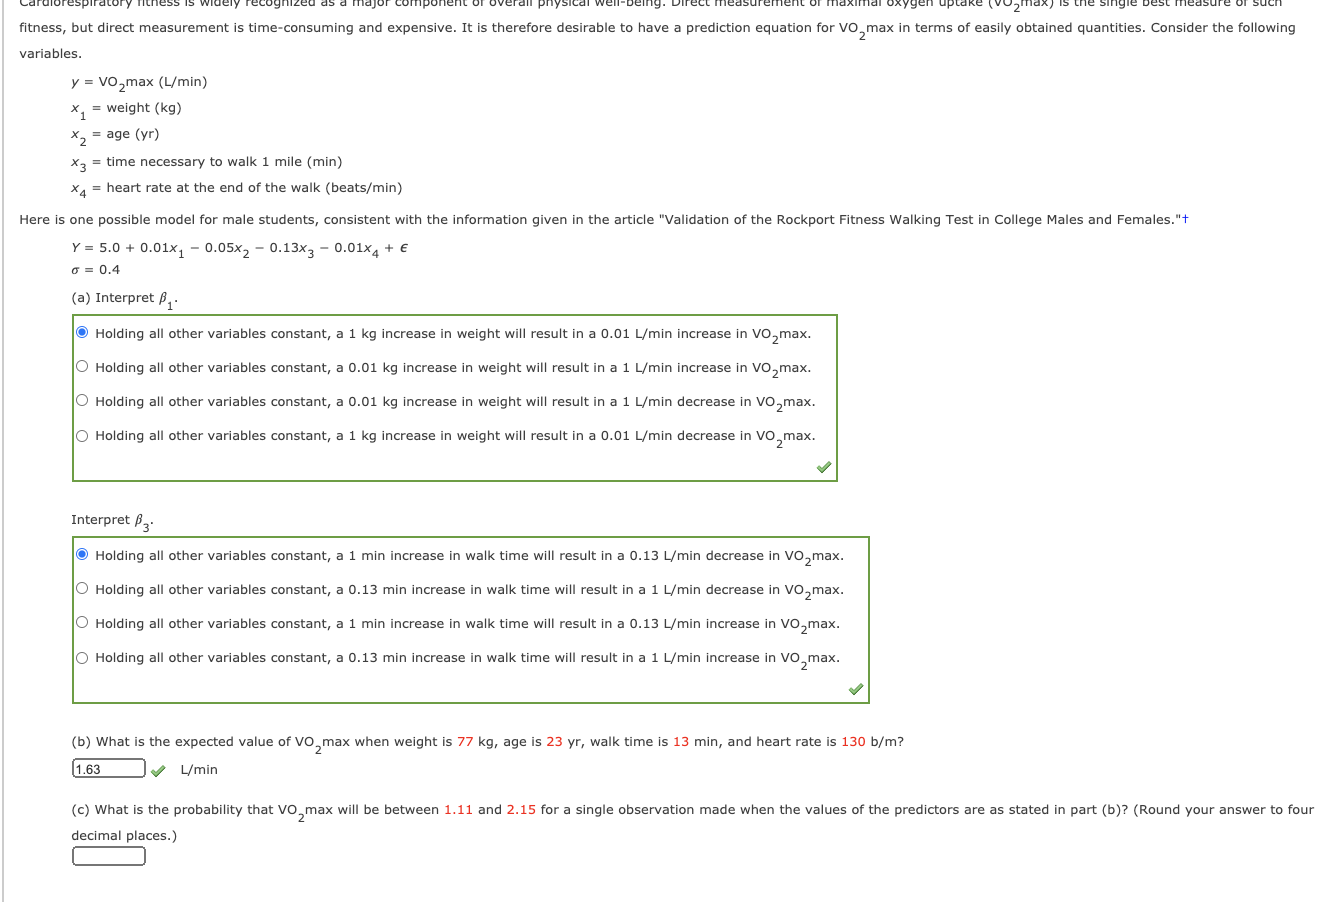
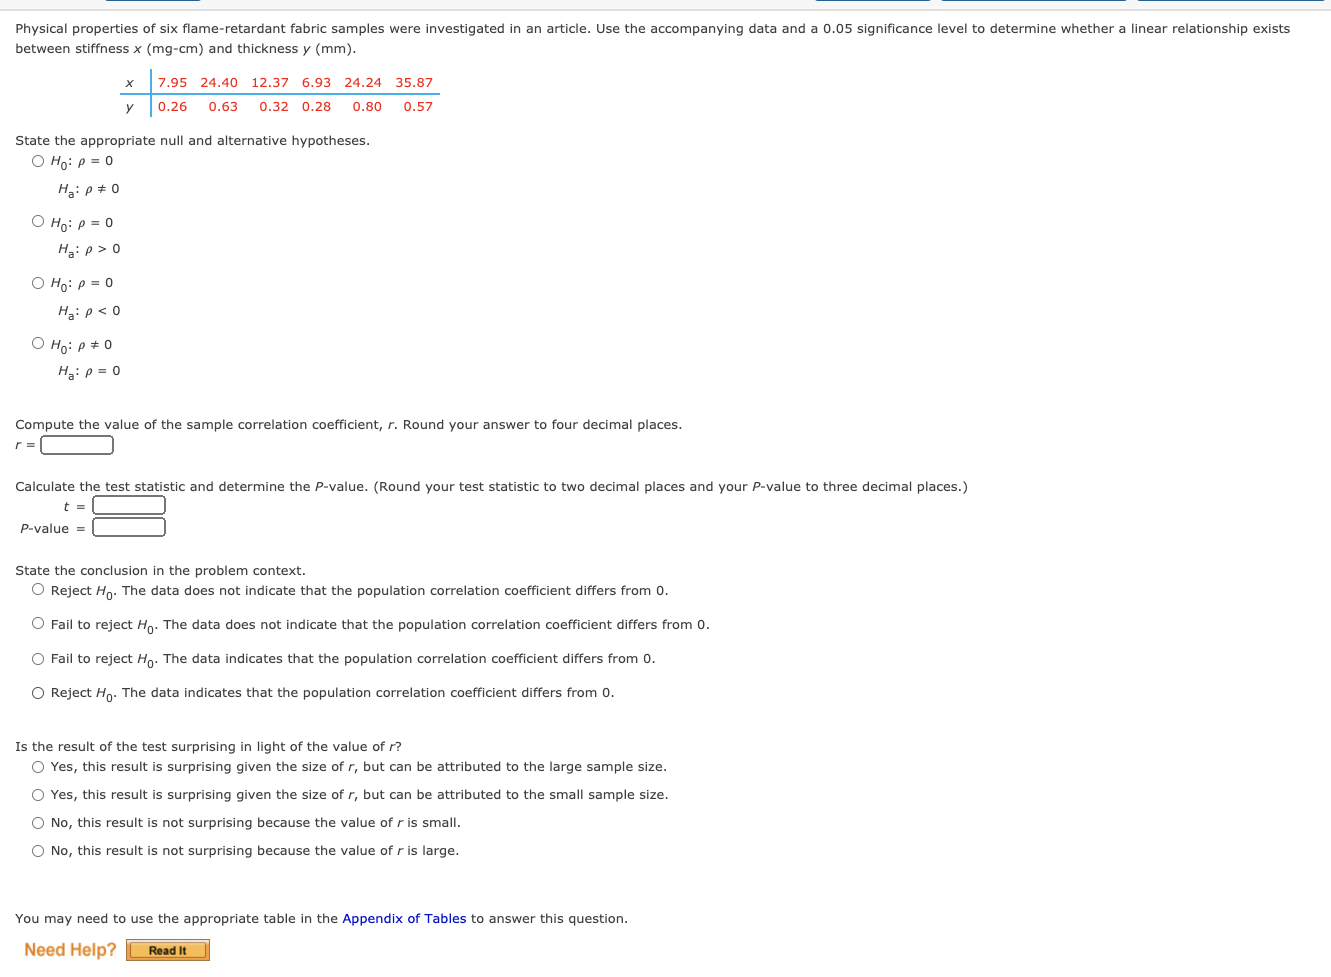
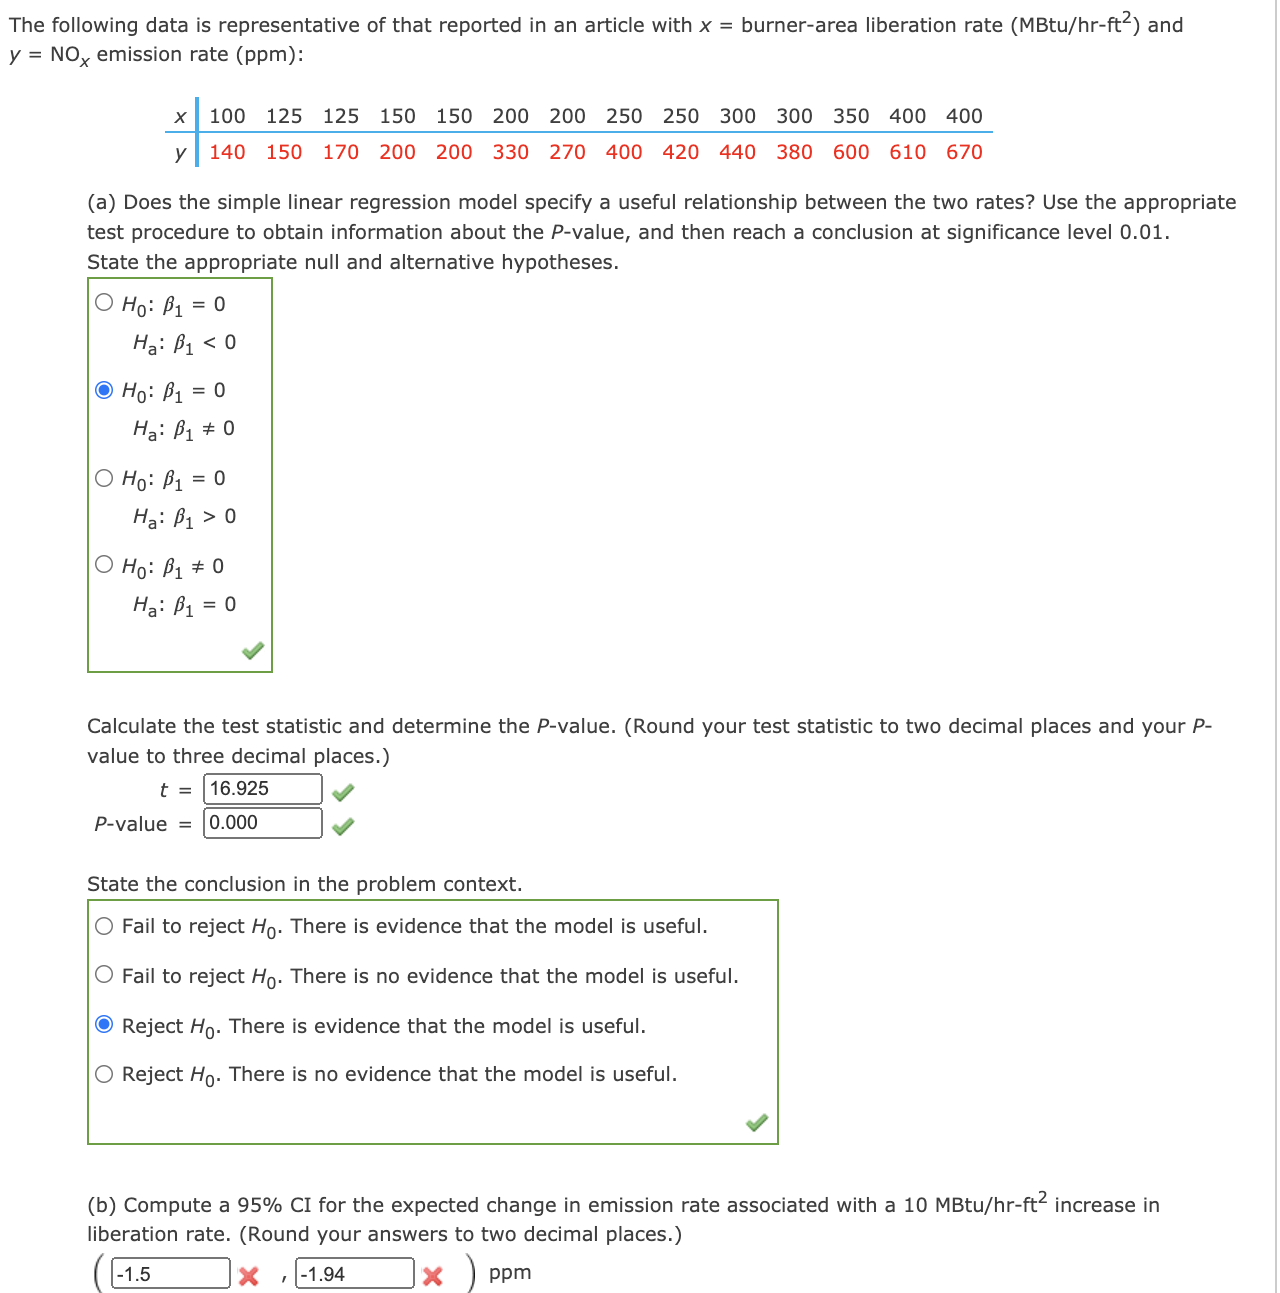
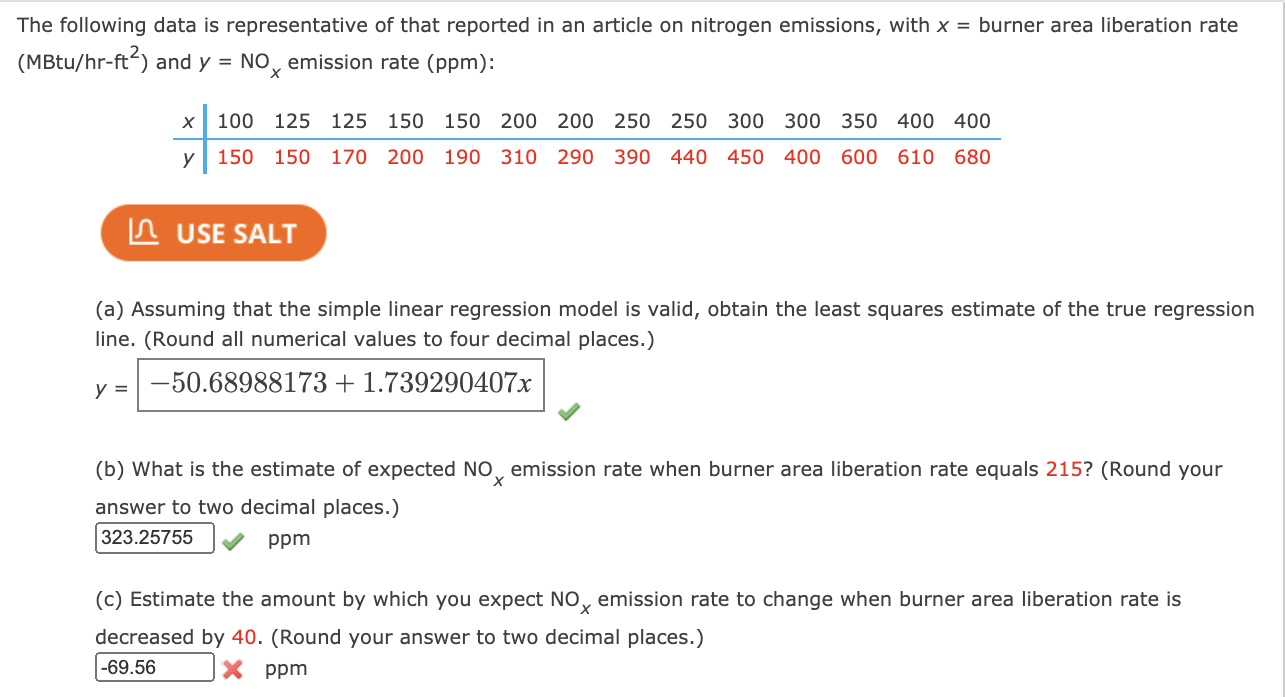
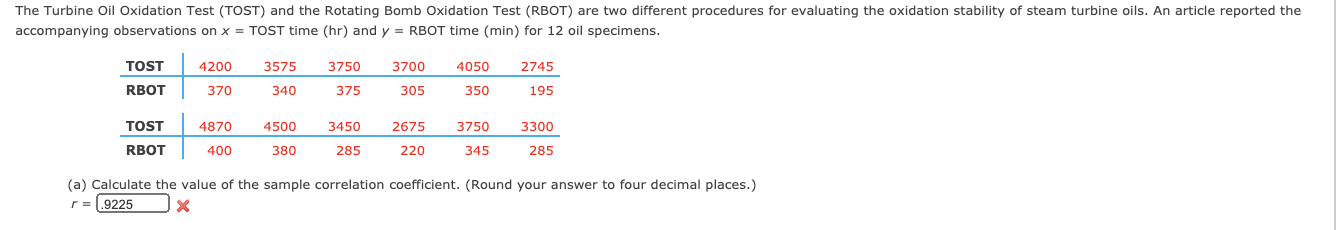
fitness, but direct measurement is time-consuming and expensive. It is therefore desirable to have a prediction equation for VO, max in terms of easily obtained quantities. Consider the following variables. y = VO,max (L/min) x, = weight (kg) X, = age (yr) *3 = time necessary to walk 1 mile (min) x4 = heart rate at the end of the walk (beats/min) Here is one possible model for male students, consistent with the information given in the article "Validation of the Rockport Fitness Walking Test in College Males and Females."+ Y = 5.0 + 0.01x1 - 0.05X2 - 0.13x3 - 0.01x4 + E 6 = 0.4 (a) Interpret P Holding all other variables constant, a 1 kg increase in weight will result in a 0.01 L/min increase in VO,max. Holding all other variables constant, a 0.01 kg increase in weight will result in a 1 L/min increase in VO,max. O Holding all other variables constant, a 0.01 kg increase in weight will result in a 1 L/min decrease in VO,max. O Holding all other variables constant, a 1 kg increase in weight will result in a 0.01 L/min decrease in VO, max. Interpret P3. Holding all other variables constant, a 1 min increase in walk time will result in a 0.13 L/min decrease in VO, max. O Holding all other variables constant, a 0.13 min increase in walk time will result in a 1 L/min decrease in VO, max. Holding all other variables constant, a 1 min increase in walk time will result in a 0.13 L/min increase in VO,max. O Holding all other variables constant, a 0.13 min increase in walk time will result in a 1 L/min increase in VO, max. (b) What is the expected value of VO, max when weight is 77 kg, age is 23 yr, walk time is 13 min, and heart rate is 130 b/m? 1.63 L/min (c) What is the probability that VO, max will be between 1.11 and 2.15 for a single observation made when the values of the predictors are as stated in part (b)? (Round your answer to four decimal places.)Physical properties of six flame-retardant fabric samples were investigated In an article. Use the accompanying data and a 0.05 significance level to determine whether a linear relationship exists between stiffness x (mg-cm) and thickness y (mm). x 195 24.40 12.37 6.93 24.24 35.3? y 0.26 0.63 0.32 0.28 0.80 0.57 State the appropriate null and alternative hypotheses. 0 HI]: p - 0 Ha: p at n O H0: ,3 - I) Ha: p > 0 Compute the value of the sample correlation coefcient, r. Round your answer to four decimal places. r-I:1 Calculate the test statistic and determine the P-value. (Round your test statistic to two decimal places and your Pvalue to three decimal places.) r - :1 Pvalue - :1 State the conclusion in the problem context. 0 Reject H0. The data does not indicate that the population correlation coefficient differs from 0. O Fail to reject H0. The data does not Indicate that the population correlation coefficient differs from I). O Fail to reject Ho. The data indicates that the population correlation coefficient differs from I). O Reject HD' The data indicates that the population correlation coefficient differs from I). Is the result of the test surprising in light of the value of r? 0 Yes, this result is surprising given the size of r, but can be attributed to the large sample size. 0 Yes, this result is surprising given the size of r. but can be attributed to the small sample size. 0 Nof this result is not surprising because the value of r is small. 0 No, this result is not surprising because the value of r is large. You may need to use the appropriate table in the Appendix of'l'ables to answer this question. Need Help? E The following data is representative of that reported in an article with x = burner-area liberation rate (MBtu/hrftz) and y = NOX emission rate (ppm): X 100 125 125 150 150 200 200 250 250 300 300 350 400 400 y 140 150 170 200 200 330 270 400 420 440 380 600 610 670 (a) Does the simple linear regression model specify a useful relationship between the two rates? Use the appropriate test procedure to obtain information about the Pvalue, and then reach a conclusion at signicance level 0.01. State the appropriate null and alternative hypotheses. Calculate the test statistic and determine the P-value. (Round your test statistic to two decimal places and your P- value to three decimal places.) t = 16.925 ,, Pvalue = 0.000 g State the conclusion in the problem context. 0 Fail to reject Ho. There is evidence that the model is useful. 0 Fail to reject \"0- There is no evidence that the model is useful. Reject \"0- There is evidence that the model is useful. 0 Reject H0. There is no evidence that the model is useful. (b) Compute a 95% CI for the expected change in emission rate associated with a 10 MBtu/hr-ft2 increase in liberation rate. (Round your answers to two decimal places.) _8 -x )Ppm The following data is representative of that reported in an article on nitrogen emissions, with x = burner area liberation rate (MBtu/hr-ftz) and y = NOX emission rate (ppm): x 100 125 125 150 150 200 200 250 250 300 300 350 400 400 y 150 150 170 200 190 310 290 390 440 450 400 600 610 680 la USE SALT (a) Assuming that the simple linear regression model is valid, obtain the least squares estimate of the true regression line. (Round all numerical values to four decimal places.) y = *5U.68988173 + 1.739290407x \\/ (b) What is the estimate of expected NOX emission rate when burner area liberation rate equals 215? (Round your answer to two decimal places.) 32325755 ppm (c) Estimate the amount by which you expect NOX emission rate to change when burner area liberation rate is decreased by 40. (Round your answer to two decimal places.) -x ppm The Turbine Oil Oxidation Test (TOST) and the Rotating Bomb Oxidation Test (RBOT) are two different procedures for evaluating the oxidation stability of steam turbine oils. An article reported the accompanying observations on x = TOST time (hr) and y = RBOT time (min) for 12 oil specimens. TOST 4200 3575 3750 3700 4050 2745 RBOT 370 340 375 305 350 195 TOST 4870 4500 3450 2675 3750 3300 RBOT 400 380 285 220 345 285 (a) Calculate the value of the sample correlation coefficient. (Round your answer to four decimal places.) r = .9225 X