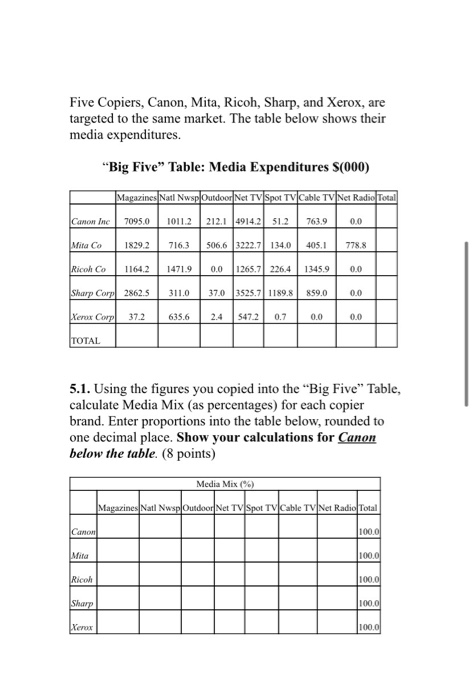
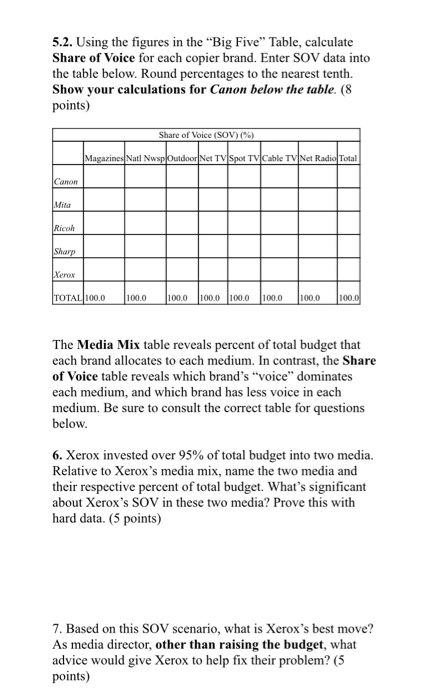
Five Copiers, Canon, Mita, Ricoh, Sharp, and Xerox, are targeted to the same market. The table below shows their media expenditures. "Big Five" Table: Media Expenditures S(000) Magazines Natl Nwsp Outdoor Net TV Spot TV Cable TV Net Radio Total Canon Inc 7095.0 10112 212.1 4914.2) 51.2 763.9 0.0 Mita Co 1829.2 716.3 506,6 3222.7 134.0 405.1 778.8 Ricoh Co 1164.2 1471.9 0.0 1265.71 226.4 1345.9 0.0 Sharp Carpl 2862.5 311.0 37.0 3525.7 1189.8 859.0 0.0 Xerox Corp 37.2 635.6 2.4 547.2 0.7 0.0 0.0 TOTAL 5.1. Using the figures you copied into the Big Five" Table, calculate Media Mix (as percentages) for each copier brand. Enter proportions into the table below, rounded to one decimal place. Show your calculations for Canon below the table. (8 points) Media Mix (%) MagazinesNatl NuspOutdoorNet TV Spot TV Cable TV Net Radio Total Canon 100.0 Mita 100.0 Ricoh 100.0 Sharp 100,0 Xerox 100.0 5.2. Using the figures in the Big Five" Table, calculate Share of Voice for each copier brand. Enter SOV data into the table below. Round percentages to the nearest tenth. Show your calculations for Canon below the table. (8 points) Share of Voice (SOV) (%) Magazines Natl Nusp Outdoor Net TV Spot TV Cable TV Net Radio Total Canon Mita Ricoh Sharp Xerox TOTAL 100.0 100.0 100.0 100.0 100.0 100.0 100.0 100.0 The Media Mix table reveals percent of total budget that each brand allocates to each medium. In contrast, the Share of Voice table reveals which brand's "voice" dominates each medium, and which brand has less voice in each medium. Be sure to consult the correct table for questions below. 6. Xerox invested over 95% of total budget into two media. Relative to Xerox's media mix, name the two media and their respective percent of total budget. What's significant about Xerox's SOV in these two media? Prove this with hard data. (5 points) 7. Based on this SOV scenario, what is Xerox's best move? As media director, other than raising the budget, what advice would give Xerox to help fix their problem? (5 points) Five Copiers, Canon, Mita, Ricoh, Sharp, and Xerox, are targeted to the same market. The table below shows their media expenditures. "Big Five" Table: Media Expenditures S(000) Magazines Natl Nwsp Outdoor Net TV Spot TV Cable TV Net Radio Total Canon Inc 7095.0 10112 212.1 4914.2) 51.2 763.9 0.0 Mita Co 1829.2 716.3 506,6 3222.7 134.0 405.1 778.8 Ricoh Co 1164.2 1471.9 0.0 1265.71 226.4 1345.9 0.0 Sharp Carpl 2862.5 311.0 37.0 3525.7 1189.8 859.0 0.0 Xerox Corp 37.2 635.6 2.4 547.2 0.7 0.0 0.0 TOTAL 5.1. Using the figures you copied into the Big Five" Table, calculate Media Mix (as percentages) for each copier brand. Enter proportions into the table below, rounded to one decimal place. Show your calculations for Canon below the table. (8 points) Media Mix (%) MagazinesNatl NuspOutdoorNet TV Spot TV Cable TV Net Radio Total Canon 100.0 Mita 100.0 Ricoh 100.0 Sharp 100,0 Xerox 100.0 5.2. Using the figures in the Big Five" Table, calculate Share of Voice for each copier brand. Enter SOV data into the table below. Round percentages to the nearest tenth. Show your calculations for Canon below the table. (8 points) Share of Voice (SOV) (%) Magazines Natl Nusp Outdoor Net TV Spot TV Cable TV Net Radio Total Canon Mita Ricoh Sharp Xerox TOTAL 100.0 100.0 100.0 100.0 100.0 100.0 100.0 100.0 The Media Mix table reveals percent of total budget that each brand allocates to each medium. In contrast, the Share of Voice table reveals which brand's "voice" dominates each medium, and which brand has less voice in each medium. Be sure to consult the correct table for questions below. 6. Xerox invested over 95% of total budget into two media. Relative to Xerox's media mix, name the two media and their respective percent of total budget. What's significant about Xerox's SOV in these two media? Prove this with hard data. (5 points) 7. Based on this SOV scenario, what is Xerox's best move? As media director, other than raising the budget, what advice would give Xerox to help fix their problem? (5 points)


