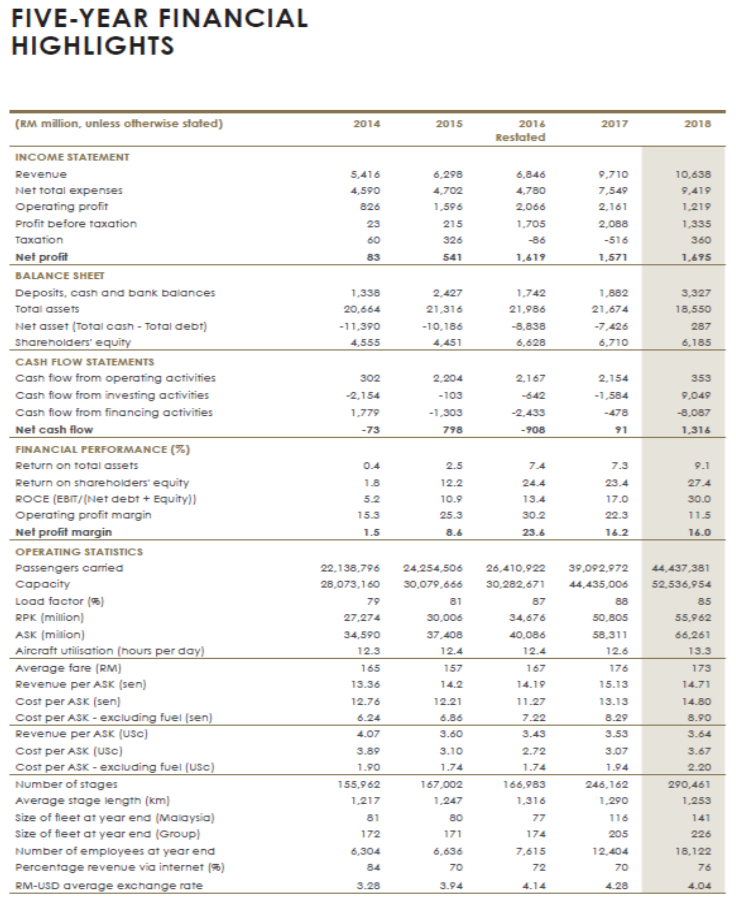
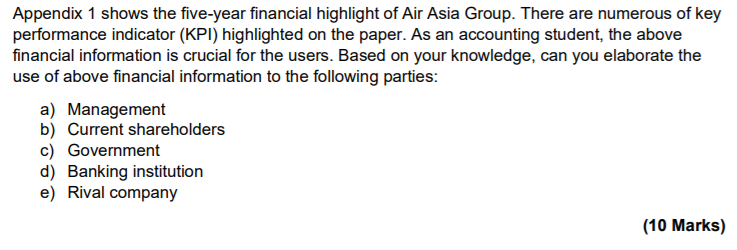
FIVE-YEAR FINANCIAL HIGHLIGHTS 2014 2015 2016 Restated 2017 2018 6,298 4,702 1.596 5,416 4,590 826 23 60 83 6,846 4.780 2.066 1,705 -86 1,619 9,710 7,549 2,161 2,088 -516 10,638 9.419 1.219 1,335 360 1.695 215 326 541 1,571 1.338 20,664 -11,390 4,555 2.427 21,316 -10,186 4.451 1.742 21.986 -8.838 6.628 1.882 21,674 -7,426 6,710 3,327 18,550 287 6,185 2,154 -1,584 302 -2,154 1.779 -73 2.204 -103 -1,303 798 2,167 -642 -2.433 - 908 353 9,049 -8,087 1.316 91 0.4 2.5 9.1 (RM million, unless otherwise stated) INCOME STATEMENT Revenue Net total expenses Operating profit Profit before taxation Taxation Net profit BALANCE SHEET Deposits, cash and bank balances Total assets Net asset (Total cash - Total debt) Shareholders' equity CASH FLOW STATEMENTS Cash flow from operating activities Cash flow from investing activities Cash flow from financing activities Net cash flow FINANCIAL PERFORMANCE (%) Return on total assets Return on shareholders' equity ROCE (EBIT/(Net debt + Equity)] Operating profit margin Net profit margin OPERATING STATISTICS Passengers carried Capacity Load factor (5) RPK (million) ASK (million) Aircraft utilisation (nours per day) Average fare (RM) Revenue per ASK (sen) Cost per ASK (sen) Cost per ASK - excluding fuel (sen) Revenue per ASK (USC) Cost per ASK (USC) Cost per ASK-excluding fuel (USC) Number of stages Average stage length (km) Size of fleet at year end (Malaysia) Size of fleet at year end (Group) Number of employees at year end Percentage revenue via internet (55) RM-USD average exchange rate 1.8 5.2 15.3 1.5 12.2 10.9 25.3 8.6 13.4 30.2 23.6 7.3 23.4 17.0 22.3 16.2 27.4 30.0 11.5 16.0 26,410,922 30,282,671 87 34,676 22,138,796 28,073,160 79 27,274 34,590 12.3 165 13.36 12.76 24.254,506 30,079,666 81 30,006 37.408 12.4 157 14.2 12.21 6.86 3.60 3.10 1.74 167,002 1,247 80 171 6,636 70 39,092,972 44.435,006 88 50,805 58.311 12.6 176 15.13 13.13 8.29 3.53 3.07 1.94 246,162 1,290 116 40,086 12.4 167 14.19 11.27 7.22 3.43 2.72 1.74 166,983 1,316 77 174 7,615 72 44.437,381 52,536,954 85 55,962 66.261 13.3 173 14.71 14.80 8.90 3.64 3.67 2.20 290,461 1.253 4.07 3.89 1.90 155,962 1.217 81 172 6,304 141 205 12.404 226 18,122 76 84 70 3.28 3.94 4.28 Appendix 1 shows the five-year financial highlight of Air Asia Group. There are numerous of key performance indicator (KPI) highlighted on the paper. As an accounting student, the above financial information is crucial for the users. Based on your knowledge, can you elaborate the use of above financial information to the following parties: a) Management b) Current shareholders c) Government d) Banking institution e) Rival company (10 Marks)