

Answered step by step
Verified Expert Solution
Question
1 Approved Answer
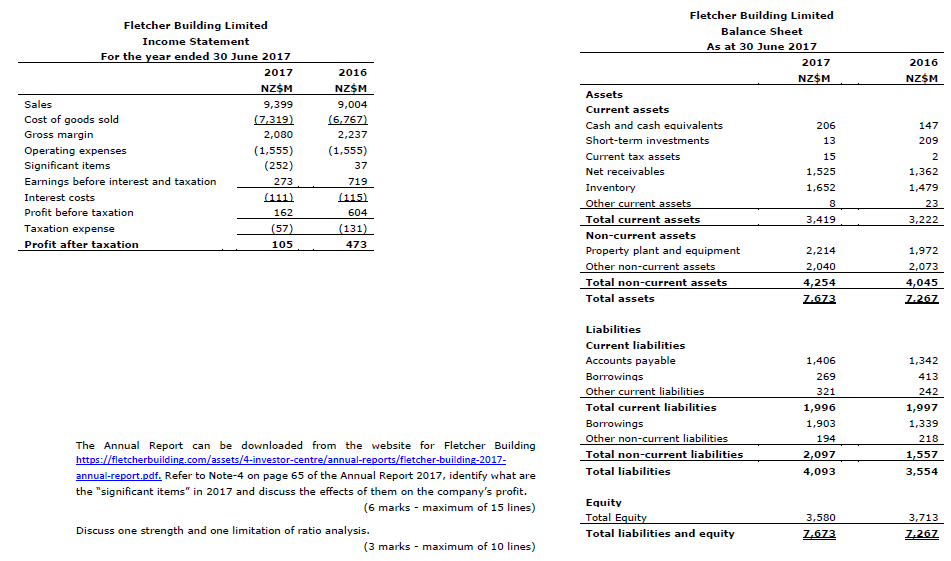
Fletcher Building Limited Income Statement Fletcher Building Limited Balance Sheet As at 30 June 2017 For the year ended 30 June 2017 2017 NZSM 9,399
Step by Step Solution
There are 3 Steps involved in it
Step: 1

Get Instant Access to Expert-Tailored Solutions
See step-by-step solutions with expert insights and AI powered tools for academic success
Step: 2

Step: 3
Ace Your Homework with AI
Get the answers you need in no time with our AI-driven, step-by-step assistance
Get Started
Farmers Irs Audit Techniques Guide
Authors: Internal Revenue Service
1st Edition
1304134237, 978-1304134233