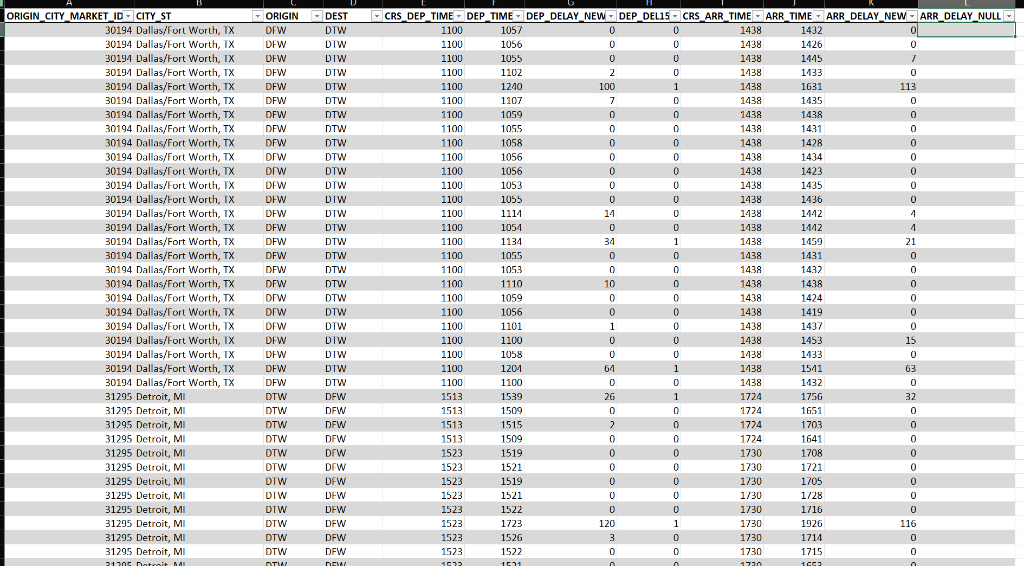


Flight Delays In this exercise, the question we are answering is, "Which specific origin/destination combinations had the highest average arrival delays in January 2016?" The original dataset contains separate ORIGIN and DEST columns that contain the data that we need, but we need to combine those values into a single column before we can answer our question. Insert a new column named ORIGIN_DEST to the right of the DEST column in the Flights table. Concatenate the text in the ORIGIN and DEST columns so that the results look like the text displayed in the example screen shot to the right (HINT: Use Lynda or the internet to learn about the CONCATENATE function if you haven't used it before). On the data tab, hit Refresh All so that the new field will appear in the pivot table field list. Insert a pivot table on a new worksheet. Name the worksheet Flight Delays Practice and move it to the right of this worksheet. The pivot table should display the ten origin/destination combinations with the largest average arrival delays, sorted in descending order. It should also include a column showing the number of flights arriving in each city (HINT: Use the ARR_DELAY_NEW to calculate these values. Your final product should be professionally formatted and labeled. While it doesn't have to be identical, it should look quite similar to the screen shot to the right. Flight Delays In this exercise, the question we are answering is, "Which specific origin/destination combinations had the highest average arrival delays in January 2016?" The original dataset contains separate ORIGIN and DEST columns that contain the data that we need, but we need to combine those values into a single column before we can answer our question. Insert a new column named ORIGIN_DEST to the right of the DEST column in the Flights table. Concatenate the text in the ORIGIN and DEST columns so that the results look like the text displayed in the example screen shot to the right (HINT: Use Lynda or the internet to learn about the CONCATENATE function if you haven't used it before). On the data tab, hit Refresh All so that the new field will appear in the pivot table field list. Insert a pivot table on a new worksheet. Name the worksheet Flight Delays Practice and move it to the right of this worksheet. The pivot table should display the ten origin/destination combinations with the largest average arrival delays, sorted in descending order. It should also include a column showing the number of flights arriving in each city (HINT: Use the ARR_DELAY_NEW to calculate these values. Your final product should be professionally formatted and labeled. While it doesn't have to be identical, it should look quite similar to the screen shot to the right


