

Answered step by step
Verified Expert Solution
Question
1 Approved Answer
%FM_Spectrum_Example % Program to verify validity of Carson's rule % The modulated FM waveform, y(t), is generated using Matlab's vco function. % It is a
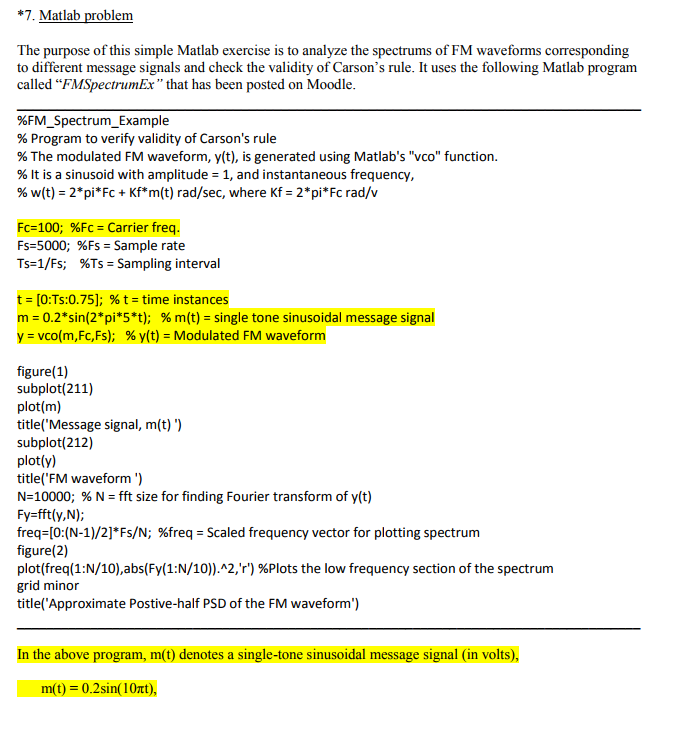
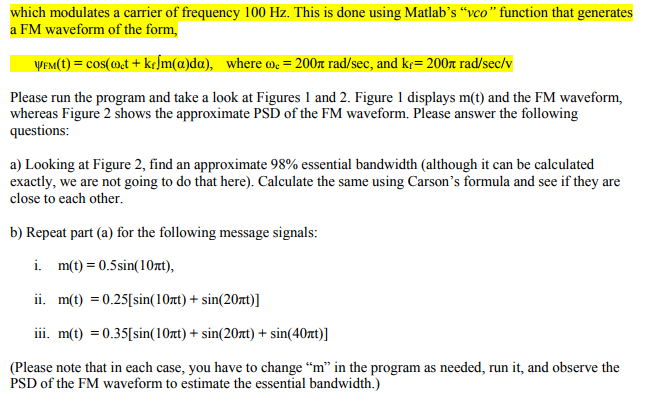
%FM_Spectrum_Example % Program to verify validity of Carson's rule % The modulated FM waveform, y(t), is generated using Matlab's "vco" function. % It is a sinusoid with amplitude = 1, and instantaneous frequency, % w(t) = 2*pi*Fc + Kf*m(t) rad/sec, where Kf = 2*pi*Fc rad/v Fc=100; %Fc = Carrier freq. Fs=5000; %Fs = Sample rate Ts=1/Fs; %Ts = Sampling interval t=[0:Ts:0.75]; m=0.2*sin(2*pi*10*t); % m(t) = single tone sinusoid message signal y=vco(m,Fc,Fs); % y(t) = Modulated FM waveform figure(1) subplot(211) plot(m) title('Message signal, m(t) ') subplot(212) plot(y) title('FM waveform ') N=10000; % N = fft size for finding Fourier transform of y(t) Fy=fft(y,N); freq=[0:(N-1)/2]*Fs/N; %freq = Scaled frequency vector for plotting spectrum figure(2) plot(freq(1:N/10),abs(Fy(1:N/10)).^2,'r') %Plots the low frequency section of the spectrum grid minor title('Approximate Postive-half PSD of the FM waveform') *7. Matlab problem The purpose of this simple Matlab exercise is to analyze the spectrums of FM waveforms corresponding to different message signals and check the validity of Carson's rule. It uses the following Matlab program called "FMSpectrumEx" that has been posted on Moodle %FM-Spectrum-Example % Program to verify validity of Carson's rule 96 The modulated FM waveform, y(t), is generated using Matlab's "vco" function 96 It is a sinusoid with amplitude = 1, and instantaneous frequency 96 w(t) = 2*pi* Fc + Kf*m(t) rad/sec, where Kf = 2*pi* Fc rad/v fc-100; 96Fc= Carrier freq. Fs=5000; %Fs= Sample rate Ts=1/Fs %Ts= Sampling interval t = [0:Ts:0.75]; % t-time instances m = 0.2*sin(2*pi*5*t); 96 m(t) = single tone sinusoidal message signal y = vco(m,Fc,Fs); % y(t)-Modulated FM waveform figure(1) subplot(211) plot(m) title('Message signal, m(t) ') subplot(212) plot(y) title('FM waveform) N-10000; % N = fft size for finding Fourier transform of y(t) Fy=fft(y,N); freq=[0:(N-1)/2]* Fs/N; %freq = Scaled frequency vector for plotting spectrum figure(2) plot(freq(1:N/10),abs(Fy(1: N/10)."2,'r') %Plots the low frequency section of the spectrum grid minor title('Approximate Postive-half PSD of the FM waveform') In the above program, m(t) denotes a single-tone sinusoidal message signal (in volts), m(t)-0-2sin( 1 0 , *7. Matlab problem The purpose of this simple Matlab exercise is to analyze the spectrums of FM waveforms corresponding to different message signals and check the validity of Carson's rule. It uses the following Matlab program called "FMSpectrumEx" that has been posted on Moodle %FM-Spectrum-Example % Program to verify validity of Carson's rule 96 The modulated FM waveform, y(t), is generated using Matlab's "vco" function 96 It is a sinusoid with amplitude = 1, and instantaneous frequency 96 w(t) = 2*pi* Fc + Kf*m(t) rad/sec, where Kf = 2*pi* Fc rad/v fc-100; 96Fc= Carrier freq. Fs=5000; %Fs= Sample rate Ts=1/Fs %Ts= Sampling interval t = [0:Ts:0.75]; % t-time instances m = 0.2*sin(2*pi*5*t); 96 m(t) = single tone sinusoidal message signal y = vco(m,Fc,Fs); % y(t)-Modulated FM waveform figure(1) subplot(211) plot(m) title('Message signal, m(t) ') subplot(212) plot(y) title('FM waveform) N-10000; % N = fft size for finding Fourier transform of y(t) Fy=fft(y,N); freq=[0:(N-1)/2]* Fs/N; %freq = Scaled frequency vector for plotting spectrum figure(2) plot(freq(1:N/10),abs(Fy(1: N/10)."2,'r') %Plots the low frequency section of the spectrum grid minor title('Approximate Postive-half PSD of the FM waveform') In the above program, m(t) denotes a single-tone sinusoidal message signal (in volts), m(t)-0-2sin( 1 0 Step by Step Solution
There are 3 Steps involved in it
Step: 1

Get Instant Access to Expert-Tailored Solutions
See step-by-step solutions with expert insights and AI powered tools for academic success
Step: 2

Step: 3
Ace Your Homework with AI
Get the answers you need in no time with our AI-driven, step-by-step assistance
Get Started
Records And Database Management
Authors: Jeffrey R Stewart Ed D, Judith S Greene, Judith A Hickey
4th Edition
0070614741, 9780070614741