Question
Following a macro and micro forecast of sales/revenues and costs based on a number of key sources of information such as: historical income statements and
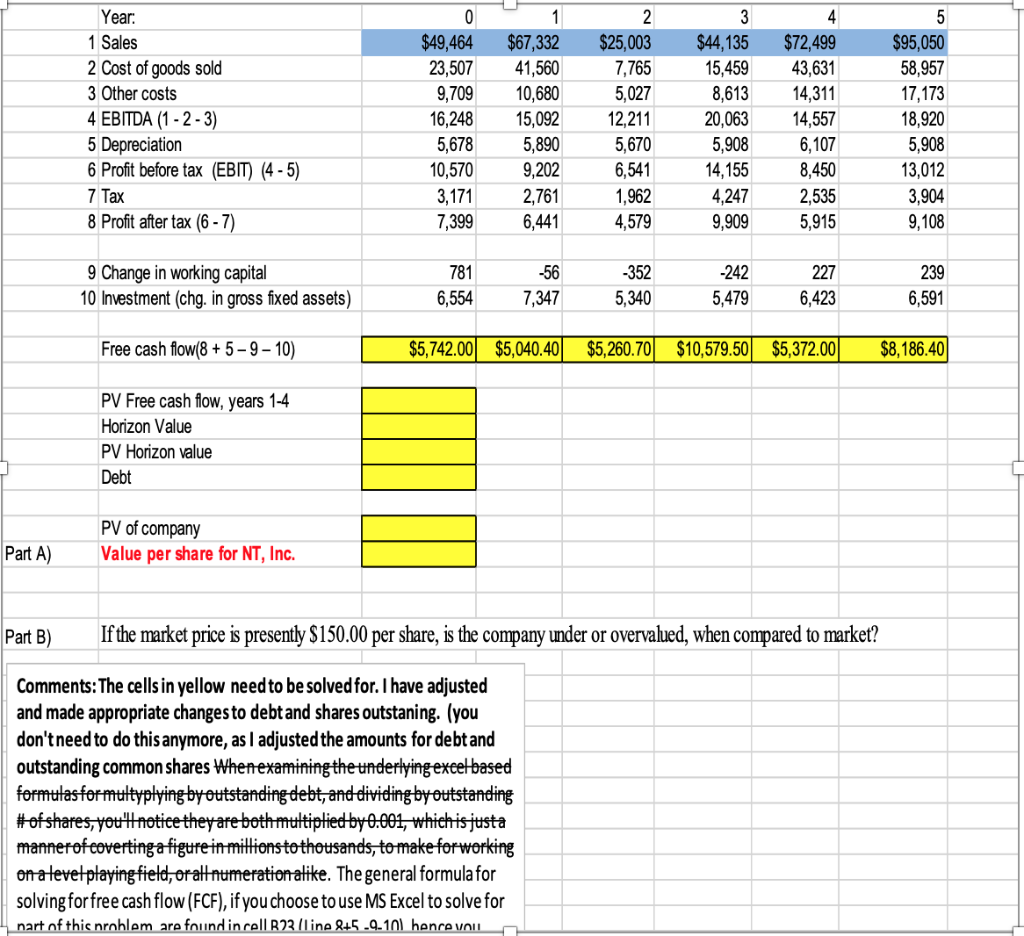
Following a macro and micro forecast of sales/revenues and costs based on a number of key sources of information such as: historical income statements and balance sheet reports, trends within AntartiK Inc.s industry, the Consumer Discretionary Goods industry (including time, scale, and risk of firms revenue) AntartiK, Inc., a direct competitor to Tesla motors, demonstrates the volatile, cyclical, and highly competitive nature of AntartiKs focus on renewable energy, storage and innovative automobile manufacturing.
The Weighted Average Cost of Capital for AntartiK Inc. is 13%. The long term growth rate starting in Year 5 and thereafter is forecasted to be 10.5%, due to high demand for this innovative companys products. The company currently holds $8,000,000 in debt instruments, as valued by the market. AntartiK, Inc. has also recently issues a second round of a common shares offering bring the current level of 1,155,000 share outstanding. The corporate tax rate is at 30% for AntartiK, Inc.
A) What is the value per share?
B) If the market price is presently $150.00 per share is the company under or overvalued?
Please provides all the steps as detailed as possible
- Calculate the free cash flow amounts for years 1 to 5, using the line #s and displayed formulas (such as Free cash flow(Lines 8 + 5 9 10).
- Discount (take the present values of) these forecasted FCF streams in years 1-4, and then the Horizon Value (H(T+1=5)/WACC g) also at Year 4. The Horizon value should be discounted separately at [1/ (1 + WACC) ^4](it can be done together as on page .
- Then sum both discounted or present values, including the stream of FCF Years 1-4, and the Horizon Value discounted from year 4. The total will represent NTs total implicit firm valuation.
- Then the next step is to transform total firm valuation into a per share basis.

Step by Step Solution
There are 3 Steps involved in it
Step: 1

Get Instant Access to Expert-Tailored Solutions
See step-by-step solutions with expert insights and AI powered tools for academic success
Step: 2

Step: 3

Ace Your Homework with AI
Get the answers you need in no time with our AI-driven, step-by-step assistance
Get Started


