

Question
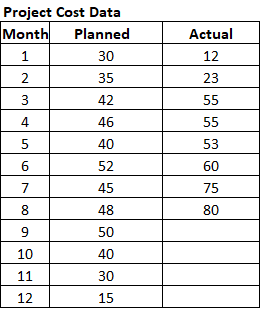
Following are cost and schedule data for a project that is underway. Using the cost data in the cost table above, create a cumulative cost
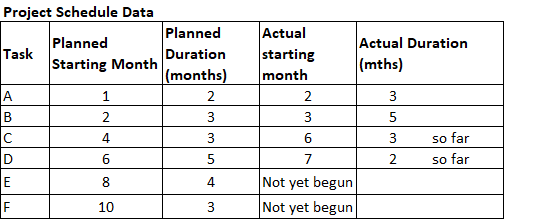
Following are cost and schedule data for a project that is underway.
Using the cost data in the cost table above, create a cumulative cost curve comparing actual versus planned costs
Using the schedule data in the schedule table above, create a Gantt chart comparing actual versus planned schedule performance
Summarize in words what you see project status to be at this time. What do you predict regarding the final cost and final schedule for the project?
Step by Step Solution
There are 3 Steps involved in it
Step: 1

Get Instant Access to Expert-Tailored Solutions
See step-by-step solutions with expert insights and AI powered tools for academic success
Step: 2

Step: 3
Ace Your Homework with AI
Get the answers you need in no time with our AI-driven, step-by-step assistance
Get Started
Financial Accounting Australia And New Zealand Edition
Authors: Jerry J. Weygandt
11th Edition
1119668654, 978-1119668657