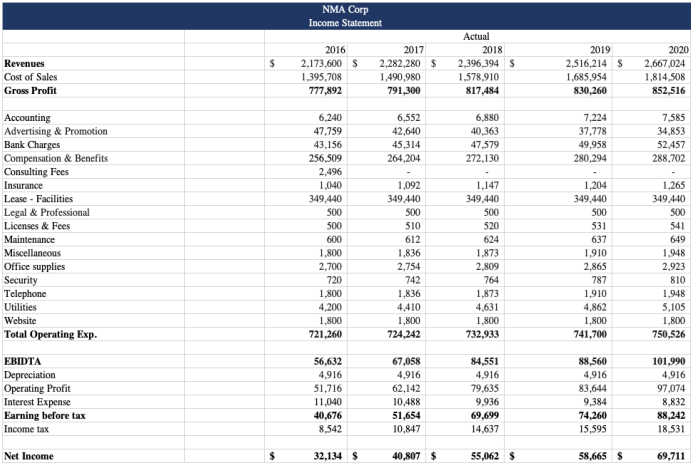
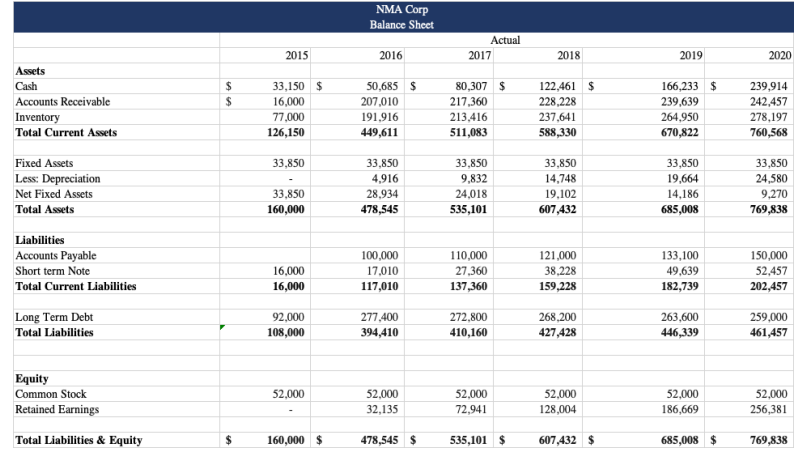
Following are the financial statements of NMA Corporation depicted below in Exhibits 1 and 2. Assume that NMA has 100,000 total outstanding shares at a market value of $400 per share for all the years in question.
1- Prepare a forecasted income statement, balance sheet, and cash flow statement for year 2021. Discuss any trends you may recognize
. a. Assume the following when constructing your statements: i. Sales growth rate for 2021 = 2020
ii. COGS: Adjust for inflation (1%) from the previous year
iii. Lease-Facilities remains the same
iv. Interest charge remains the same as 2020
v. Management plans on improving the # of days for the following items in the balance sheet: 1. A/R = 2 days improvement 2. Inventory = 2 days improvement 3. A/P = 1 day improvement
vi. Debt forecast: 1. increase in short term debt by $2,000 2. decrease in long term debt by $5,000
NMA Corp Income Statement $ Revenues Cost of Sales Gross Profit 2016 2,173,600 $ 1,395,708 777,892 2017 2,282,280 $ 1,490,980 791,300 Actual 2018 2.396,394 S 1,578,910 817,484 2019 2,516,214 S 1,685,954 830,260 2020 2,667,024 1,814,508 852,516 6,552 42,640 45,314 264,204 6,880 40,363 47,579 272,130 7,224 37,778 49,958 280,294 7,585 34,853 52,457 288,702 Accounting Advertising & Promotion Bank Charges Compensation & Benefits Consulting Fees Insurance Lease - Facilities Legal & Professional Licenses & Fees Maintenance Miscellaneous Office supplies Security Telephone Utilities Website Total Operating Exp. EBIDTA Depreciation Operating Profit Interest Expense Earning before tax Income tax 6,240 47,759 43.156 256,509 2,496 1,040 349,440 500 500 600 1.800 2,700 720 1.800 4,200 1.800 721,260 1,092 349,440 500 510 612 1,836 2,754 742 1,836 4,410 1,800 724,242 1.147 349,440 500 520 624 1,873 2.809 764 1.873 4.631 1.800 732,933 1,204 349,440 500 531 637 1,910 2.865 787 1,910 4,862 1,800 741,700 1,265 349,440 500 541 649 1.948 2.923 810 1.948 5,105 1.800 750,526 56,632 4,916 51,716 11,040 40,676 8,542 67,058 4,916 62.142 10,488 51,654 10.847 84,551 4,916 79.635 9.936 69.699 14.637 88,560 4,916 83,644 9,384 74,260 15,595 101,990 4,916 97,074 8,832 88,242 18,531 Net Income 32,134 $ 40,807 $ 55,062 58,665 $ 69,711 Industry 2018 2019 2020 2.5 1.2 5.5 9.1 2.3 1.1 5.6 9.3 2.4 1.3 5.7 9.5 36 36 37 Current ratio Quick ratio Inventory turnover Receivable turnover Average collection period Total asset turnover Return on sales Return on assets Return on equity Total debt to assets Fixed asset turnover Times interest earned 1.15 4.00% 4.60% 7.64% 0.4 76 5.75 1.16 1.18 4.00% 5.00% 4.64$ 5.90% 8.44% 12.29% 0.45 0.52 77 77 6 6 Company Y 2018 2019 2020 2.8 1.5 5.6 2.7 1.3 5.7 2.8 1.6 5.8 35 35 35 Current ratio Quick ratio Inventory turnover Average collection period Receivable turnover Fixed asset turnover Times interest earned Total asset turnover Return on sales Return on assets Return on equity Total debt to assets Price-earnings ratio 10.2 10.2 10.3 77 78 78 6.5 7 8 1.9 2 2 1.9 6.00% 6.50% 7.00% 11.40% 13.00% 13.30% 19.04% 27.66% 29.56% 0.4 0.53 0.55 13.7 14 15 $ $ $ 21.78 24.92 31.50 Average Stock price NMA Corp Balance Sheet Actual 2017 2015 2016 2018 2019 2020 Assets Cash Accounts Receivable Inventory Total Current Assets AA $ $ 33,150 $ 16,000 77,000 126,150 50,685 $ 207,010 191,916 449,611 80,307 $ 217,360 213,416 511,083 122,461 $ 228.228 237,641 588,330 166,233 $ 239,639 264,950 670,822 239,914 242,457 278,197 760,568 33,850 Fixed Assets Less: Depreciation Net Fixed Assets Total Assets 33,850 4,916 28.934 478,545 33,850 9,832 24.018 535,101 33,850 14,748 19.102 607,432 33,850 19,664 14,186 685,008 33,850 24,580 9.270 769,838 33,850 160,000 Liabilities Accounts Payable Short term Note Total Current Liabilities 16,000 16,000 100,000 17,010 117,010 110,000 27,360 137,360 121,000 38,228 159,228 133,100 49.639 182,739 150,000 52.457 202,457 Long Term Debt Total Liabilities 92.000 108,000 277.400 394,410 272,800 410,160 268,200 427,428 263,600 446,339 259.000 461,457 52,000 Equity Common Stock Retained Earnings Total Liabilities & Equity 52,000 32,135 52,000 72,941 52,000 128,004 52,000 186,669 52.000 256,381 LA 160,000 $ 478,545 $ 535,101 $ 607,432 $ 685,008 $ 769,838 NMA Corp Income Statement $ Revenues Cost of Sales Gross Profit 2016 2,173,600 $ 1,395,708 777,892 2017 2,282,280 $ 1,490,980 791,300 Actual 2018 2.396,394 S 1,578,910 817,484 2019 2,516,214 S 1,685,954 830,260 2020 2,667,024 1,814,508 852,516 6,552 42,640 45,314 264,204 6,880 40,363 47,579 272,130 7,224 37,778 49,958 280,294 7,585 34,853 52,457 288,702 Accounting Advertising & Promotion Bank Charges Compensation & Benefits Consulting Fees Insurance Lease - Facilities Legal & Professional Licenses & Fees Maintenance Miscellaneous Office supplies Security Telephone Utilities Website Total Operating Exp. EBIDTA Depreciation Operating Profit Interest Expense Earning before tax Income tax 6,240 47,759 43.156 256,509 2,496 1,040 349,440 500 500 600 1.800 2,700 720 1.800 4,200 1.800 721,260 1,092 349,440 500 510 612 1,836 2,754 742 1,836 4,410 1,800 724,242 1.147 349,440 500 520 624 1,873 2.809 764 1.873 4.631 1.800 732,933 1,204 349,440 500 531 637 1,910 2.865 787 1,910 4,862 1,800 741,700 1,265 349,440 500 541 649 1.948 2.923 810 1.948 5,105 1.800 750,526 56,632 4,916 51,716 11,040 40,676 8,542 67,058 4,916 62.142 10,488 51,654 10.847 84,551 4,916 79.635 9.936 69.699 14.637 88,560 4,916 83,644 9,384 74,260 15,595 101,990 4,916 97,074 8,832 88,242 18,531 Net Income 32,134 $ 40,807 $ 55,062 58,665 $ 69,711 Industry 2018 2019 2020 2.5 1.2 5.5 9.1 2.3 1.1 5.6 9.3 2.4 1.3 5.7 9.5 36 36 37 Current ratio Quick ratio Inventory turnover Receivable turnover Average collection period Total asset turnover Return on sales Return on assets Return on equity Total debt to assets Fixed asset turnover Times interest earned 1.15 4.00% 4.60% 7.64% 0.4 76 5.75 1.16 1.18 4.00% 5.00% 4.64$ 5.90% 8.44% 12.29% 0.45 0.52 77 77 6 6 Company Y 2018 2019 2020 2.8 1.5 5.6 2.7 1.3 5.7 2.8 1.6 5.8 35 35 35 Current ratio Quick ratio Inventory turnover Average collection period Receivable turnover Fixed asset turnover Times interest earned Total asset turnover Return on sales Return on assets Return on equity Total debt to assets Price-earnings ratio 10.2 10.2 10.3 77 78 78 6.5 7 8 1.9 2 2 1.9 6.00% 6.50% 7.00% 11.40% 13.00% 13.30% 19.04% 27.66% 29.56% 0.4 0.53 0.55 13.7 14 15 $ $ $ 21.78 24.92 31.50 Average Stock price NMA Corp Balance Sheet Actual 2017 2015 2016 2018 2019 2020 Assets Cash Accounts Receivable Inventory Total Current Assets AA $ $ 33,150 $ 16,000 77,000 126,150 50,685 $ 207,010 191,916 449,611 80,307 $ 217,360 213,416 511,083 122,461 $ 228.228 237,641 588,330 166,233 $ 239,639 264,950 670,822 239,914 242,457 278,197 760,568 33,850 Fixed Assets Less: Depreciation Net Fixed Assets Total Assets 33,850 4,916 28.934 478,545 33,850 9,832 24.018 535,101 33,850 14,748 19.102 607,432 33,850 19,664 14,186 685,008 33,850 24,580 9.270 769,838 33,850 160,000 Liabilities Accounts Payable Short term Note Total Current Liabilities 16,000 16,000 100,000 17,010 117,010 110,000 27,360 137,360 121,000 38,228 159,228 133,100 49.639 182,739 150,000 52.457 202,457 Long Term Debt Total Liabilities 92.000 108,000 277.400 394,410 272,800 410,160 268,200 427,428 263,600 446,339 259.000 461,457 52,000 Equity Common Stock Retained Earnings Total Liabilities & Equity 52,000 32,135 52,000 72,941 52,000 128,004 52,000 186,669 52.000 256,381 LA 160,000 $ 478,545 $ 535,101 $ 607,432 $ 685,008 $ 769,838