Question
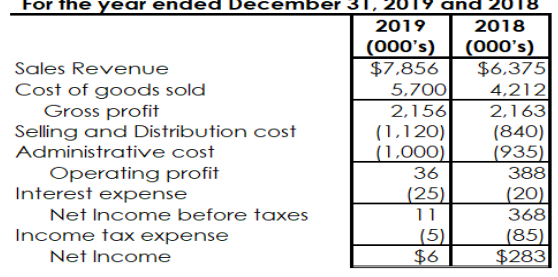
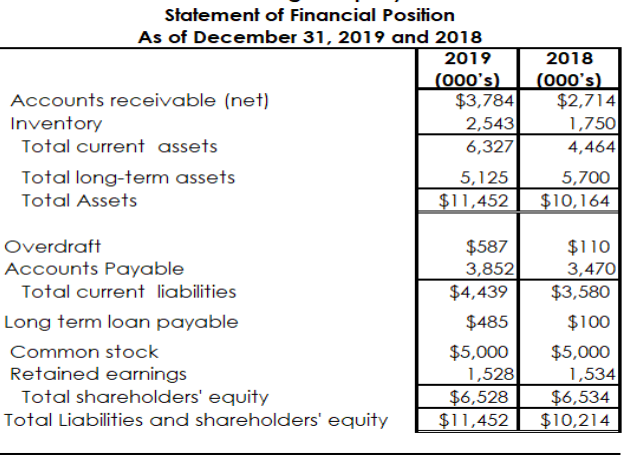
Following are the industry averages extracted from HedgeStone Inc. industry Sector report and the financial statements for 2019 and 2018. Compute the following ratios for
Following are the industry averages extracted from HedgeStone Inc. industry Sector report and the financial statements for 2019 and 2018.


Compute the following ratios for both 2018 and 2019:
i. Current ratio ii. Quick ratio iii. Gross Profit Margin iv. Profit Margin v. Return on Capital Employed vi. Return on Total Assets vii. Inventory Turnover viii. Average Collection Period x. Times Interest Earned x. Debt ratio.
b. From the ratio analysis above, separate the ratios into: i. Those ratios which support the views of the shareholders. ii. Those ratios which counter the views of the shareholders. Provide adequate supporting explanations and comments on each of the ratios to substantiate why they have been classified as either (i) or (ii). Make reference to industry averages, where appropriate.
Industry Averages 1. Current Ratio 1.85 6. Return on Total Assets 2. Acid test Ratio 1.21 7. Inventory Turnover 3. Gross Profit Margin 37.5% 8. Average Collection Period 4. Net Profit Margin 7.8% 9. Times Interest Earned 5. Return on Capital Employed 10.2% 10. Debt Ratio 6.7% 4.1 75 days 15 55% For the year ended December 31, and 2019 2018 (000's) (000's) Sales Revenue $7,856 $6,375 Cost of goods sold 5,700 4,212 Gross profit 2,156 2,163 Selling and Distribution cost (1,120) (840) Administrative cost (1,000) 1935) Operating profit 36 388 Interest expense (25) (20) Net Income before taxes 11 368 Income tax expense (5) (85) Net Income $6 $283 Statement of Financial Position As of December 31, 2019 and 2018 2019 (000's) Accounts receivable (net) $3,784 Inventory 2,543 Total current assets 6,327 Total long-term assets 5,125 Total Assets $11,452 2018 (000's) $2,714 1,750 4,464 5,700 $10,164 Overdraft Accounts Payable Total current liabilities Long term loan payable Common stock Retained earnings Total shareholders' equity Total Liabilities and shareholders' equity $587 3,852 $4,439 $485 $5,000 1,528 $6,528 $11,452 $110 3,470 $3,580 $100 $5,000 1,534 $6,534 $10,214 Industry Averages 1. Current Ratio 1.85 6. Return on Total Assets 2. Acid test Ratio 1.21 7. Inventory Turnover 3. Gross Profit Margin 37.5% 8. Average Collection Period 4. Net Profit Margin 7.8% 9. Times Interest Earned 5. Return on Capital Employed 10.2% 10. Debt Ratio 6.7% 4.1 75 days 15 55% For the year ended December 31, and 2019 2018 (000's) (000's) Sales Revenue $7,856 $6,375 Cost of goods sold 5,700 4,212 Gross profit 2,156 2,163 Selling and Distribution cost (1,120) (840) Administrative cost (1,000) 1935) Operating profit 36 388 Interest expense (25) (20) Net Income before taxes 11 368 Income tax expense (5) (85) Net Income $6 $283 Statement of Financial Position As of December 31, 2019 and 2018 2019 (000's) Accounts receivable (net) $3,784 Inventory 2,543 Total current assets 6,327 Total long-term assets 5,125 Total Assets $11,452 2018 (000's) $2,714 1,750 4,464 5,700 $10,164 Overdraft Accounts Payable Total current liabilities Long term loan payable Common stock Retained earnings Total shareholders' equity Total Liabilities and shareholders' equity $587 3,852 $4,439 $485 $5,000 1,528 $6,528 $11,452 $110 3,470 $3,580 $100 $5,000 1,534 $6,534 $10,214Step by Step Solution
There are 3 Steps involved in it
Step: 1

Get Instant Access to Expert-Tailored Solutions
See step-by-step solutions with expert insights and AI powered tools for academic success
Step: 2

Step: 3

Ace Your Homework with AI
Get the answers you need in no time with our AI-driven, step-by-step assistance
Get Started


