

Question
Following are the questions that needs to be answered using the data given in the picture: 1. Create a timeline graph of the daily Covid-19
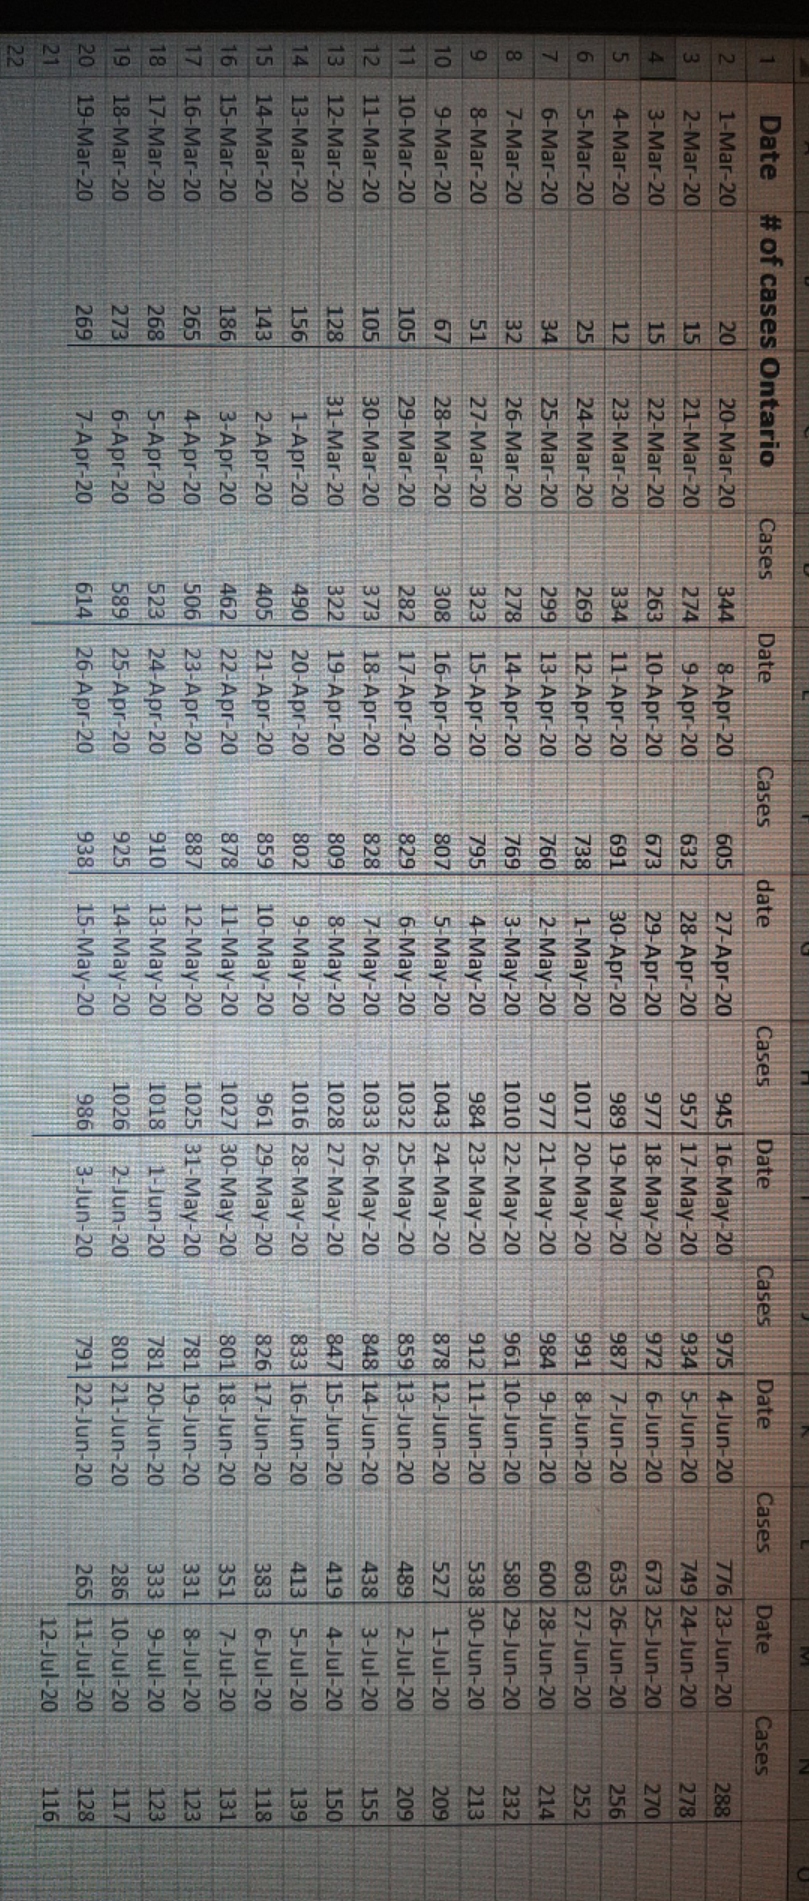
Following are the questions that needs to be answered using the data given in the picture: 1. Create a timeline graph of the daily Covid-19 cases in Ontario 2. Calculate the IQR 3. Identify any outliers in the data 4. Calculate mean, median, range, and standard deviation and explain which is the better measure of central tendency? 5. Assume that the number of daily Covid-19 cases in Ontario is approximately normally distributed ( it isn't exactly normally distributed, but close enough for us to use the z- scores to calculated approximate probabilities). Calculate mean and use that to answer the following questions ( remember that this is discrete data, so we must use the continuity correction factor) : a. what is the probability that a day selected at random will have fewer than 450 cases ? b. what is the probability that a day selected at random will have more than 750 cases ? c. what is the probability that a day selected at random will have at least 450 cases, and at most 650 cases? d. what is the probability that a day selected at random will have at least 650 cases, and at most 750 cases?
Step by Step Solution
There are 3 Steps involved in it
Step: 1

Get Instant Access to Expert-Tailored Solutions
See step-by-step solutions with expert insights and AI powered tools for academic success
Step: 2

Step: 3
Ace Your Homework with AI
Get the answers you need in no time with our AI-driven, step-by-step assistance
Get Started
Holt Algebra 1 Ohio
Authors: Edward B. Burger, Holt, Rinehart And Winston
Student Edition
0030932947, 978-0030932946