

Answered step by step
Verified Expert Solution
Question
1 Approved Answer
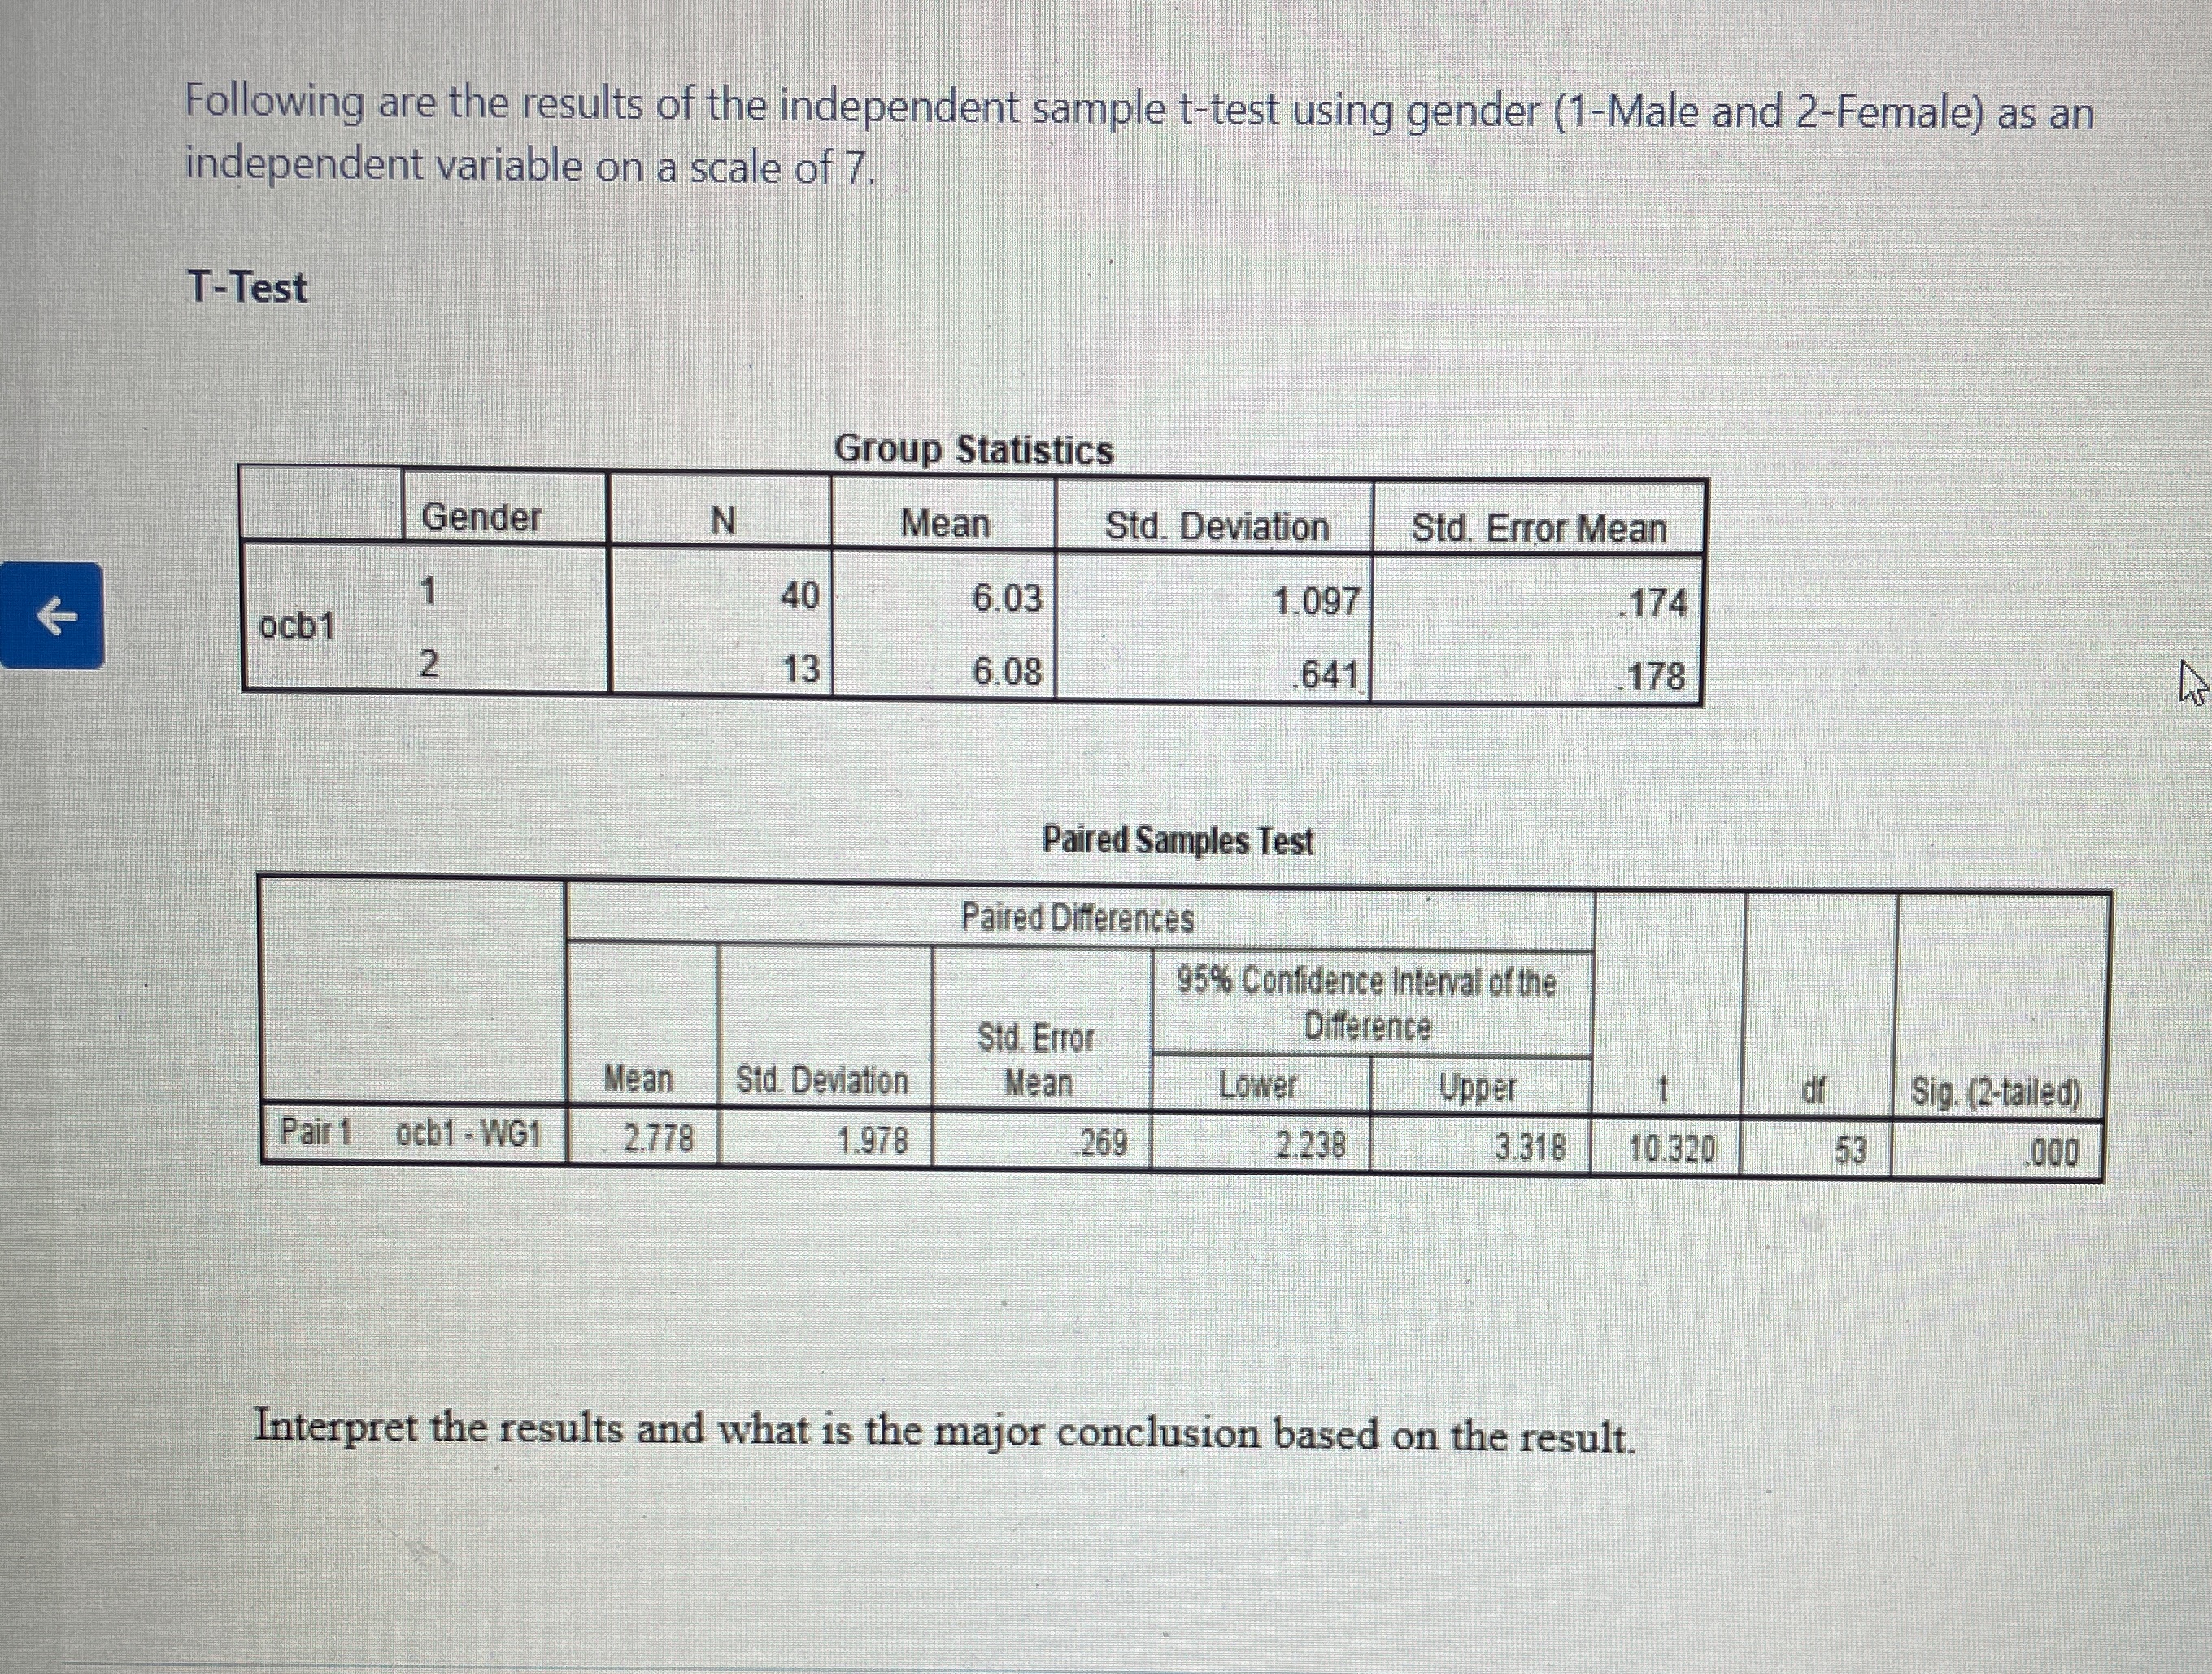
Following are the results of the independent sample t-test using gender (1-Male and 2-Female) as an independent variable on a scale of 7. T-Test Group
Step by Step Solution
There are 3 Steps involved in it
Step: 1

Get Instant Access to Expert-Tailored Solutions
See step-by-step solutions with expert insights and AI powered tools for academic success
Step: 2

Step: 3
Ace Your Homework with AI
Get the answers you need in no time with our AI-driven, step-by-step assistance
Get Started
Strategic Management Text And Cases
Authors: Gregory Dess , Gerry McNamara , Alan Eisner , Steve Sauerwald
11th Edition
1264124325, 978-1264124329