

Question
Following is information on the price per share and the dividend for a sample of 30 companies. Obs Price Dividend 1 20.11 3.14 2 22.12
Following is information on the price per share and the dividend for a sample of 30 companies.
| Obs | Price | Dividend |
| 1 | 20.11 | 3.14 |
| 2 | 22.12 | 3.36 |
| 3 | 31.50 | 0.46 |
| 4 | 33.68 | 7.99 |
| 5 | 35.97 | 0.77 |
| 6 | 36.23 | 8.46 |
| 7 | 36.27 | 7.62 |
| 8 | 38.10 | 8.03 |
| 9 | 38.96 | 6.33 |
| 10 | 39.76 | 7.96 |
| 11 | 43.55 | 8.95 |
| 12 | 49.19 | 9.61 |
| 13 | 53.84 | 11.11 |
| 14 | 54.52 | 13.28 |
| 15 | 55.21 | 10.22 |
| 16 | 57.17 | 9.53 |
| 17 | 57.51 | 12.60 |
| 18 | 58.41 | 10.43 |
| 19 | 59.62 | 7.97 |
| 20 | 60.71 | 9.19 |
| 21 | 64.12 | 16.50 |
| 22 | 64.77 | 16.10 |
| 23 | 64.85 | 13.76 |
| 24 | 65.06 | 10.54 |
| 25 | 66.54 | 21.15 |
| 26 | 68.29 | 14.30 |
| 27 | 69.67 | 24.42 |
| 28 | 75.01 | 11.54 |
| 29 | 78.02 | 17.65 |
| 30 | 80.11 | 17.36 |
a. Calculate the regression equation that predicts price per share based on the annual dividend. (Round your answers to 4 decimal places.)

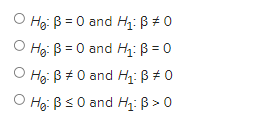
b-1. State the null and alternate hypotheses.
b-2. State the decision rule. Use the 0.05 significance level. (Round your answer to 3 decimal places.)

b-3. Compute the value of the test statistic. (Round your answer to 4 decimal places.)
b-4. What is your decision regarding H0?

b-5. Can we conclude the slope is not equal to zero?

c. Determine the coefficient of determination. (Round your answer to 4 decimal places.)

d-1. Determine the correlation coefficient. (Round your answer to 4 decimal places.)
d-2. Can you conclude that it is greater than 0 using the 0.05 significance level?

e. If the dividend is $10, what is the predicted price per share? (Round your answer to 4 decimal places.)

f. What is the 95% prediction interval of price per share if the dividend is $10? (Round your answers to 4 decimal places.) 
Step by Step Solution
There are 3 Steps involved in it
Step: 1

Get Instant Access to Expert-Tailored Solutions
See step-by-step solutions with expert insights and AI powered tools for academic success
Step: 2

Step: 3
Ace Your Homework with AI
Get the answers you need in no time with our AI-driven, step-by-step assistance
Get Started
New Realse Flipping Houses Fast
Authors: Benjamin Stone
1st Edition
979-8857478608