

Question
Following table shows information of different combination of portfolio weights in a bond and in a stock and each bonds and stocks expected returns and
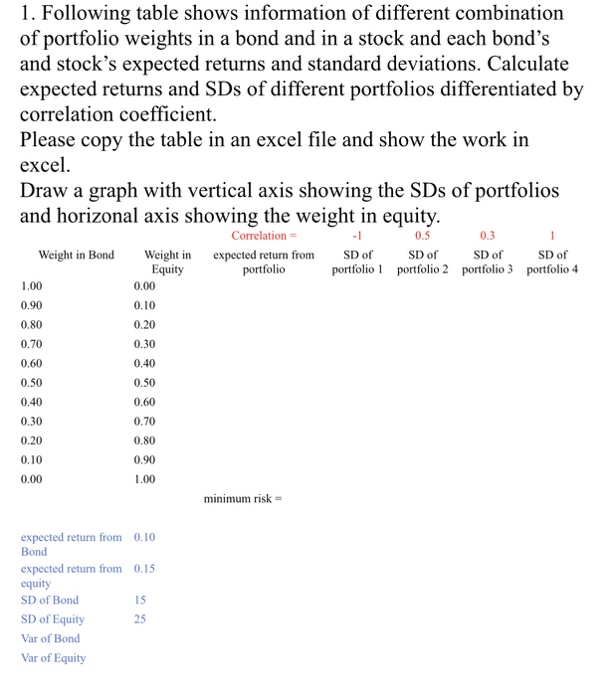
Following table shows information of different combination of portfolio weights in a bond and in a stock and each bonds and stocks expected returns and standard deviations. Calculate expected returns and SDs of different portfolios differentiated by correlation coefficient.
Please copy the table in an excel file and show the work in excel.
Draw a graph with vertical axis showing the SDs of portfolios and horizonal axis showing the weight in equity.
|
|
| Correlation = | -1 | 0.5 | 0.3 | 1 |
| Weight in Bond | Weight in Equity | expected return from portfolio | SD of portfolio 1 | SD of portfolio 2 | SD of portfolio 3 | SD of portfolio 4 |
| 1.00 | 0.00 |
|
|
|
|
|
| 0.90 | 0.10 |
|
|
|
|
|
| 0.80 | 0.20 |
|
|
|
|
|
| 0.70 | 0.30 |
|
|
|
|
|
| 0.60 | 0.40 |
|
|
|
|
|
| 0.50 | 0.50 |
|
|
|
|
|
| 0.40 | 0.60 |
|
|
|
|
|
| 0.30 | 0.70 |
|
|
|
|
|
| 0.20 | 0.80 |
|
|
|
|
|
| 0.10 | 0.90 |
|
|
|
|
|
| 0.00 | 1.00 |
|
|
|
|
|
|
|
| minimum risk = |
|
|
|
|
|
|
|
|
|
|
|
|
| expected return from Bond | 0.10 |
|
|
|
|
|
| expected return from equity | 0.15 |
|
|
|
|
|
| SD of Bond | 15 |
|
|
|
|
|
| SD of Equity | 25 |
|
|
|
|
|
| Var of Bond |
|
|
|
|
|
|
| Var of Equity |
|
|
|
|
|
|
Step by Step Solution
There are 3 Steps involved in it
Step: 1

Get Instant Access to Expert-Tailored Solutions
See step-by-step solutions with expert insights and AI powered tools for academic success
Step: 2

Step: 3
Ace Your Homework with AI
Get the answers you need in no time with our AI-driven, step-by-step assistance
Get Started
Own Your Money
Authors: Michela Allocca
1st Edition
0760381127, 978-0760381120