Answered step by step
Verified Expert Solution
Question
1 Approved Answer
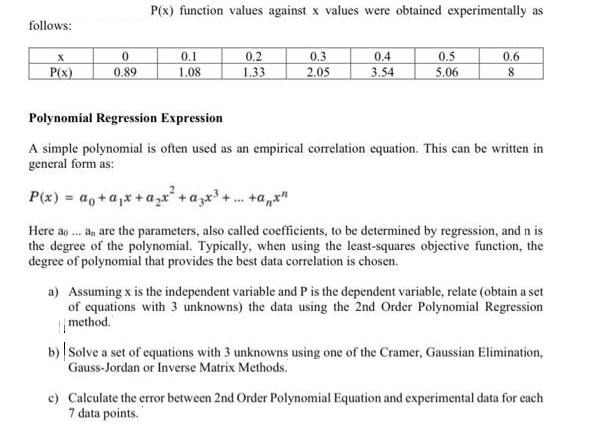
follows: X P(x) 0 0.89 P(x) function values against x values were obtained experimentally as 0.1 1.08 0.2 1.33 0.3 2.05 0.4 3.54 0.5

follows: X P(x) 0 0.89 P(x) function values against x values were obtained experimentally as 0.1 1.08 0.2 1.33 0.3 2.05 0.4 3.54 0.5 5.06 0.6 8 Polynomial Regression Expression A simple polynomial is often used as an empirical correlation equation. This can be written in general form as: P(x) = a + ax + ax + zx+ +ax" Here ao... an are the parameters, also called coefficients, to be determined by regression, and n is the degree of the polynomial. Typically, when using the least-squares objective function, the degree of polynomial that provides the best data correlation is chosen. a) Assuming x is the independent variable and P is the dependent variable, relate (obtain a set of equations with 3 unknowns) the data using the 2nd Order Polynomial Regression method. b) Solve a set of equations with 3 unknowns using one of the Cramer, Gaussian Elimination, Gauss-Jordan or Inverse Matrix Methods. c) Calculate the error between 2nd Order Polynomial Equation and experimental data for each 7 data points.
Step by Step Solution
There are 3 Steps involved in it
Step: 1

Get Instant Access to Expert-Tailored Solutions
See step-by-step solutions with expert insights and AI powered tools for academic success
Step: 2

Step: 3

Ace Your Homework with AI
Get the answers you need in no time with our AI-driven, step-by-step assistance
Get Started


