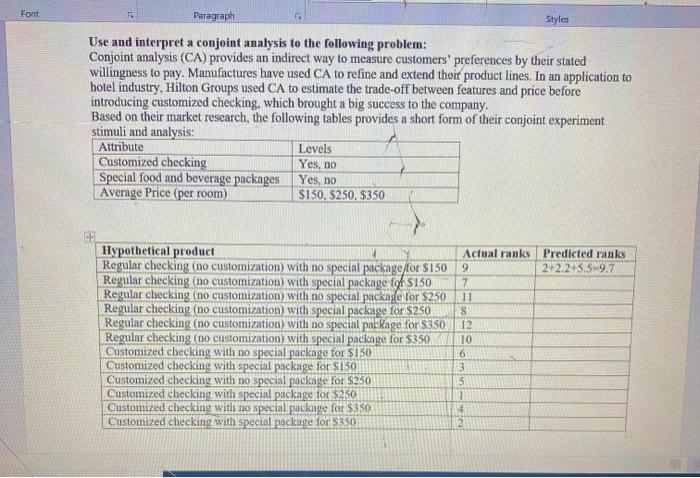
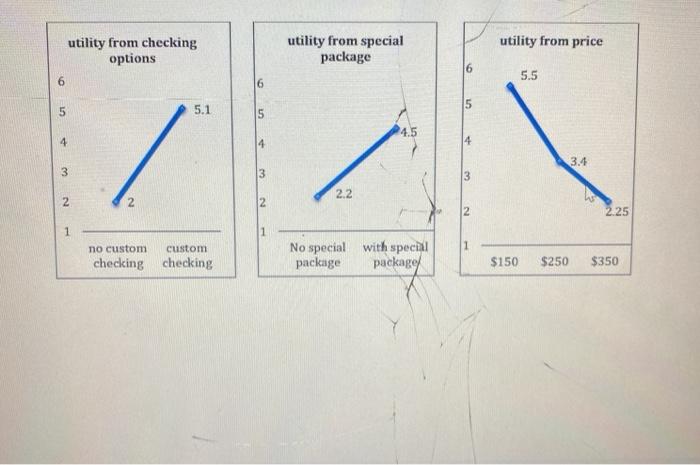
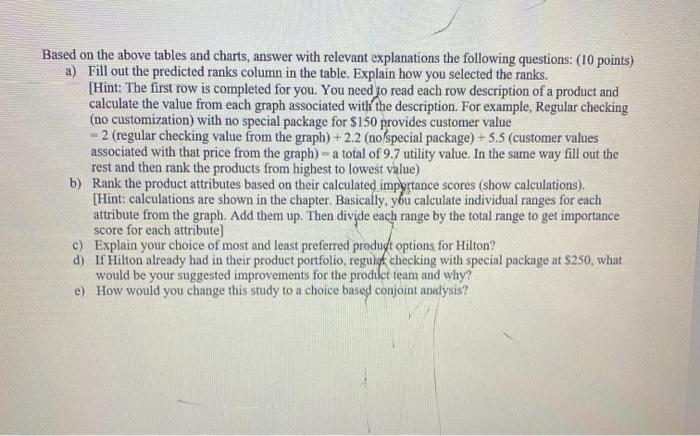
Font Paragraph Styles Use and interpret a conjoint analysis to the following problem: Conjoint analysis (CA) provides an indirect way to measure customers' preferences by their stated willingness to pay. Manufactures have used CA to refine and extend their product lines. In an application to hotel industry, Hilton Groups used CA to estimate the trade-off between features and price before introducing customized checking, which brought a big success to the company. Based on their market research, the following tables provides a short form of their conjoint experiment stimuli and analysis: Attribute Levels Customized checking Yes, no Special food and beverage packages Yes, no Average Price (per room) $150, $250, $350 CH Hypothetical product Actual ranks Predicted ranks Regular checking (no customization with no special package for SISO 9 2.2.2.3.5.9.7 Regular checking (no customization with special package for $150 7 Regular checking (no customization with no special package for $250 11 Regular checking (no customization with special package for $250 8 Regular checking (no customization with no special package for $350 12 Regular checking (no customization with special package for $350 TO Customized checking with no special package for $150 Customized checking with special package for $150 3 Customized checking with po special package for $250 Customized checking with special package for $250 Customized checking with no special package for $350 4 Customized checking with special package for S350 2 6 5 utility from checking options utility from special package utility from price 16 5.5 6 16 5 5.1 5 5 4.5 4 4 14 3.4 3 3 3 2.2 2 2 2 2 2.25 1 no custom custom 1 checking checking No special with special package package $150 $250 $350 Based on the above tables and charts, answer with relevant explanations the following questions: (10 points) a) Fill out the predicted ranks column in the table. Explain how you selected the ranks. [Hint: The first row is completed for you. You need to read each row description of a product and calculate the value from each graph associated with the description. For example, Regular checking (no customization) with no special package for $150 provides customer value = 2 (regular checking value from the graph) +2.2 (no special package)+5.5 (customer values associated with that price from the graph) - a total of 9.7 utility value. In the same way fill out the rest and then rank the products from highest to lowest value) b) Rank the product attributes based on their calculated importance scores (show calculations). [Hint: calculations are shown in the chapter. Basically, you calculate individual ranges for each attribute from the graph. Add them up. Then divide each range by the total range to get importance score for each attribute) C) Explain your choice of most and least preferred produdt options for Hilton? d) If Hilton already had in their product portfolio, regulg checking with special package at $250, what would be your suggested improvements for the product team and why? e) How would you change this study to a choice based conjoint analysis? Font Paragraph Styles Use and interpret a conjoint analysis to the following problem: Conjoint analysis (CA) provides an indirect way to measure customers' preferences by their stated willingness to pay. Manufactures have used CA to refine and extend their product lines. In an application to hotel industry, Hilton Groups used CA to estimate the trade-off between features and price before introducing customized checking, which brought a big success to the company. Based on their market research, the following tables provides a short form of their conjoint experiment stimuli and analysis: Attribute Levels Customized checking Yes, no Special food and beverage packages Yes, no Average Price (per room) $150, $250, $350 CH Hypothetical product Actual ranks Predicted ranks Regular checking (no customization with no special package for SISO 9 2.2.2.3.5.9.7 Regular checking (no customization with special package for $150 7 Regular checking (no customization with no special package for $250 11 Regular checking (no customization with special package for $250 8 Regular checking (no customization with no special package for $350 12 Regular checking (no customization with special package for $350 TO Customized checking with no special package for $150 Customized checking with special package for $150 3 Customized checking with po special package for $250 Customized checking with special package for $250 Customized checking with no special package for $350 4 Customized checking with special package for S350 2 6 5 utility from checking options utility from special package utility from price 16 5.5 6 16 5 5.1 5 5 4.5 4 4 14 3.4 3 3 3 2.2 2 2 2 2 2.25 1 no custom custom 1 checking checking No special with special package package $150 $250 $350 Based on the above tables and charts, answer with relevant explanations the following questions: (10 points) a) Fill out the predicted ranks column in the table. Explain how you selected the ranks. [Hint: The first row is completed for you. You need to read each row description of a product and calculate the value from each graph associated with the description. For example, Regular checking (no customization) with no special package for $150 provides customer value = 2 (regular checking value from the graph) +2.2 (no special package)+5.5 (customer values associated with that price from the graph) - a total of 9.7 utility value. In the same way fill out the rest and then rank the products from highest to lowest value) b) Rank the product attributes based on their calculated importance scores (show calculations). [Hint: calculations are shown in the chapter. Basically, you calculate individual ranges for each attribute from the graph. Add them up. Then divide each range by the total range to get importance score for each attribute) C) Explain your choice of most and least preferred produdt options for Hilton? d) If Hilton already had in their product portfolio, regulg checking with special package at $250, what would be your suggested improvements for the product team and why? e) How would you change this study to a choice based conjoint analysis