Question
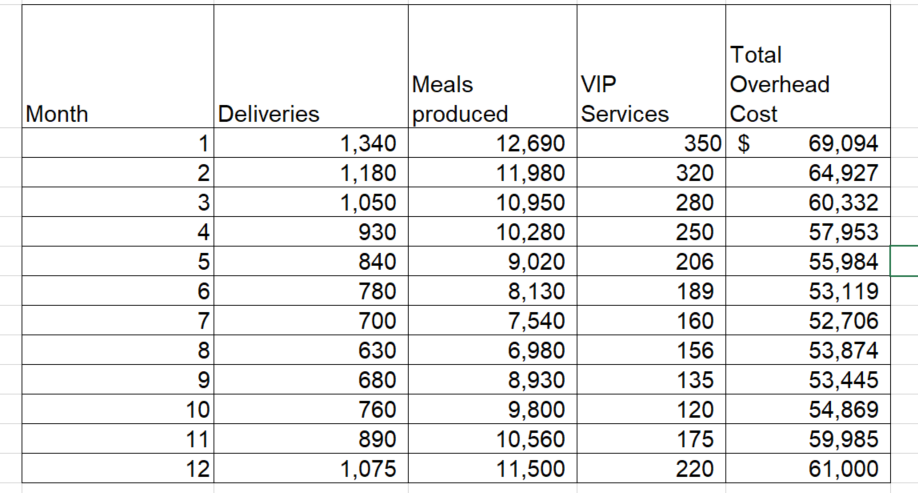
Food services company is looking at the costs involved with their catering services. In the past, the company has used meals produced as the cost
Food services company is looking at the costs involved with their catering services. In the past, the company has used meals produced as the cost driver for Overhead costs, but you have been recently hired as an accounting consultant and have decided to use your new skills to make a recommendation to management on what should be the cost driver(s) for overhead costs. You have decided to include the number of deliveries and the number of VIP(special) services in your analysis, too.

Required:
1 3 scattergraphs and 3 simple regression analyses***** to estimate the Overhead costs using each of the cost drivers above.show the equation of the line and R-squared on each of your scattergraphs. Type the equation of the line under the regression output on each of the simple regression worksheets.
2. a multiple regression table using all 3 of the independent variables. Using the output from the multiple regression, give the equation to estimate overhead costs in terms of these 3 cost drivers.
Identify the independent variables that relate to your multiple regression output below.
X1 Deliveries
X2
X3
Type out the equation of the line on your multiple regression worksheet.
3. Assuming the following level of cost-driver volume, what is the estimated overhead cost using simple regression for each of the cost drivers and using multiple regression to estimate the cost of overhead.
Cost Drivers (independent variables):
Deliveries 1,070
Meals produced 11,420
VIP Services 215
4. Using the simple and multiple regression analyses above, what independent variable(s) would you recommend to estimate the Overhead Costs? Why?
Total Meals VIP Overhead Month Deliveries produced Services Cost 1 1,340 12,690 350 $ 69,094 234567 1,180 11,980 320 64,927 3 1,050 10,950 280 60,332 4 930 10,280 250 57,953 840 9,020 206 55,984 780 8,130 189 53,119 7 700 7,540 160 52,706 8 630 6,980 156 53,874 9 680 8,930 135 53,445 10 760 9,800 120 54,869 11 890 10,560 175 59,985 12 1,075 11,500 220 61,000
Step by Step Solution
There are 3 Steps involved in it
Step: 1
Sure I can help you with this consulting problem 1 Scattergraphs and Simple Regression Analysis To analyze the relationship between overhead costs and ...
Get Instant Access to Expert-Tailored Solutions
See step-by-step solutions with expert insights and AI powered tools for academic success
Step: 2

Step: 3

Ace Your Homework with AI
Get the answers you need in no time with our AI-driven, step-by-step assistance
Get Started


