Food & Staples Retailing + Food & Beverages

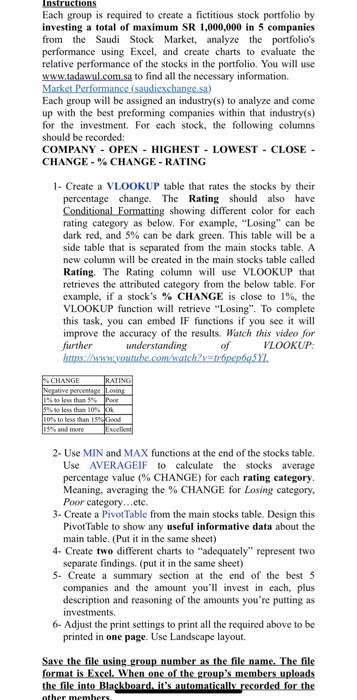
Instructions Each group is required to create a fictitious stock portfolio by investing a total of maximum SR 1,000,000 in 5 companies from the Saudi Stock Market, analyze the portfolio's performance using Excel, and create charts to evaluate the relative performance of the stocks in the portfolio. You will use www.tadawul.com.sa to find all the necessary information. Market Performance (saudiexchainge sa) Each group will be assigned an industry(s) to analyze and come up with the best preforming companies within that industry(s) for the investment. For each stock, the following columns should be recorded: COMPANY - OPEN - HIGHEST - LOWEST - CLOSE CHANGE - % CHANGE - RATING 1- Create a VLOOKUP table that rates the stocks by their percentage change. The Rating should also have Conditional Formatting showing different color for each rating eategory as below, For example, "Losing" ean be dark red, and 5% can be dark green. This table will be a side table that is separated from the main stocks table. A new column will be created in the main stocks table called Rating. The Rating column will use VLOOKUP that retrieves the attributed category from the below table. For example, if a stock's % CHANGE is close to 1%, the VLOOKUP function will retrieve "Losing". To complete this task, you can embed IF functions if you see it will improve the accuracy of the results. Watch this video for further understanding of VLOOKUP. hitps: hurry youtube com watch? = ingieporg 5Y 2- Use MIN and MAX functions at the end of the stocks table. Use AVERAGEIF to calculate the stocks average percentage value (\% CHANGE) for each rating category. Meaning, averaging the \% CHANGE for Lasing category, Poor category...,etc. 3- Create a PivotTable from the main stocks table. Design this PivotTable to show any useful informative data about the main table. (Put it in the same sheet) 4- Create two different charts to "adequately" represent two separate findings. (put it in the same sheet) 5- Create a summary section at the end of the best 5 companies and the amount you'll invest in each, plus description and reasoning of the amounts you're putting as investments. 6- Adjust the print settings to print all the required above to be printed in one page. Use Landscape layout. Save the file using_group number as the file name. The file format is Excel. When one of the group's members uploads the file into Blackboard. it's automatically recorded for the


