Question
For #1-6 refer to the quantitative data frequency table below. Scenario: The frequency table below shows the sale prices (in thousands) of all houses

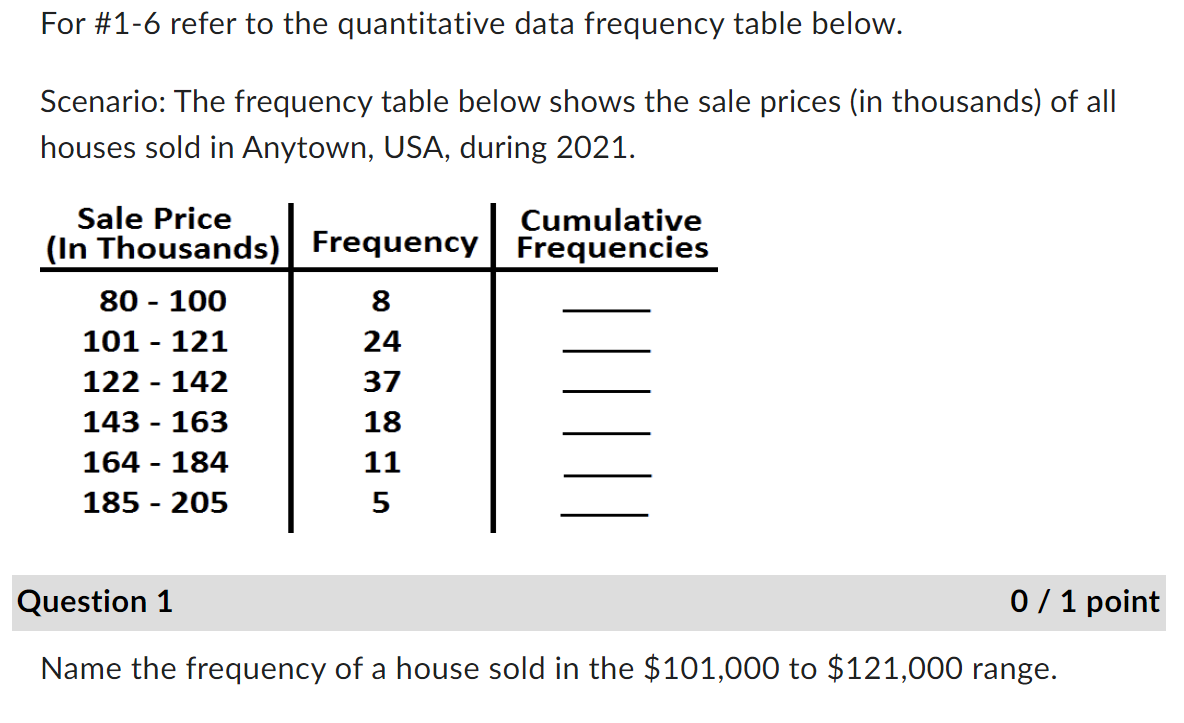
For #1-6 refer to the quantitative data frequency table below. Scenario: The frequency table below shows the sale prices (in thousands) of all houses sold in Anytown, USA, during 2021. Sale Price Cumulative (In Thousands) Frequency Frequencies 80-100 8 101 - 121 24 122 - 142 37 143-163 18 164 - 184 11 185-205 5 Question 1 0 / 1 point Name the frequency of a house sold in the $101,000 to $121,000 range.
Step by Step Solution
There are 3 Steps involved in it
Step: 1
The frequenc...
Get Instant Access to Expert-Tailored Solutions
See step-by-step solutions with expert insights and AI powered tools for academic success
Step: 2

Step: 3

Ace Your Homework with AI
Get the answers you need in no time with our AI-driven, step-by-step assistance
Get StartedRecommended Textbook for
Introduction To Business Statistics
Authors: Ronald M. Weiers
7th Edition
978-0538452175, 538452196, 053845217X, 2900538452198, 978-1111524081
Students also viewed these Accounting questions
Question
Answered: 1 week ago
Question
Answered: 1 week ago
Question
Answered: 1 week ago
Question
Answered: 1 week ago
Question
Answered: 1 week ago
Question
Answered: 1 week ago
Question
Answered: 1 week ago
Question
Answered: 1 week ago
Question
Answered: 1 week ago
Question
Answered: 1 week ago
Question
Answered: 1 week ago
Question
Answered: 1 week ago
Question
Answered: 1 week ago
Question
Answered: 1 week ago
Question
Answered: 1 week ago
Question
Answered: 1 week ago
Question
Answered: 1 week ago
Question
Answered: 1 week ago
Question
Answered: 1 week ago
Question
Answered: 1 week ago
Question
Answered: 1 week ago
View Answer in SolutionInn App


