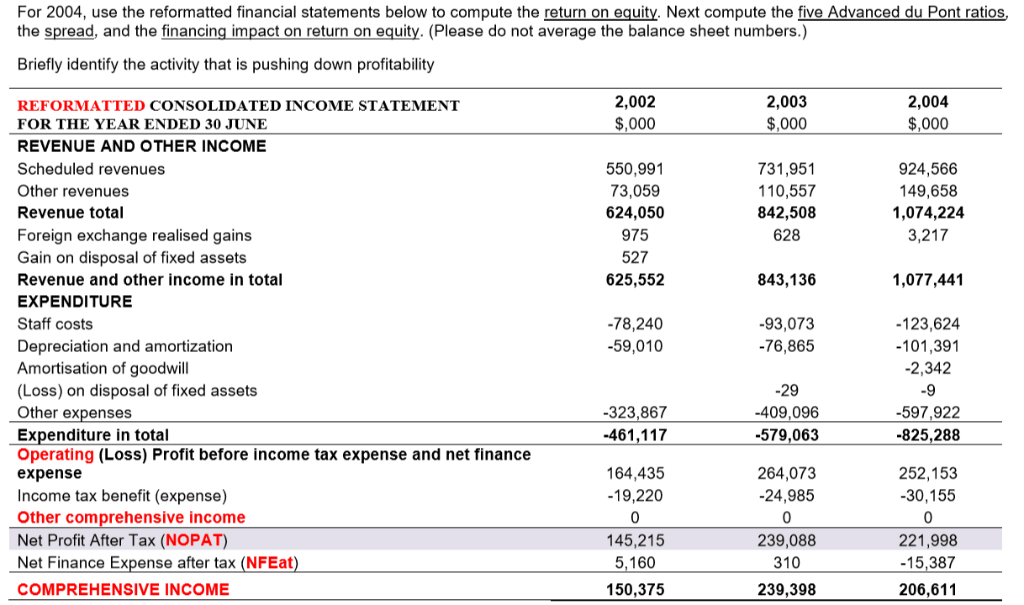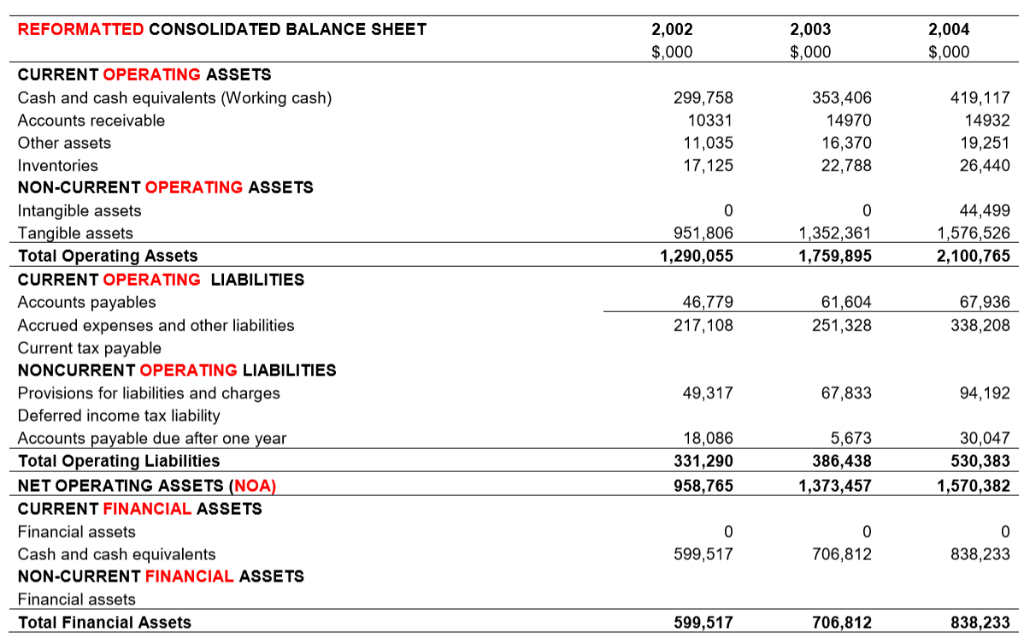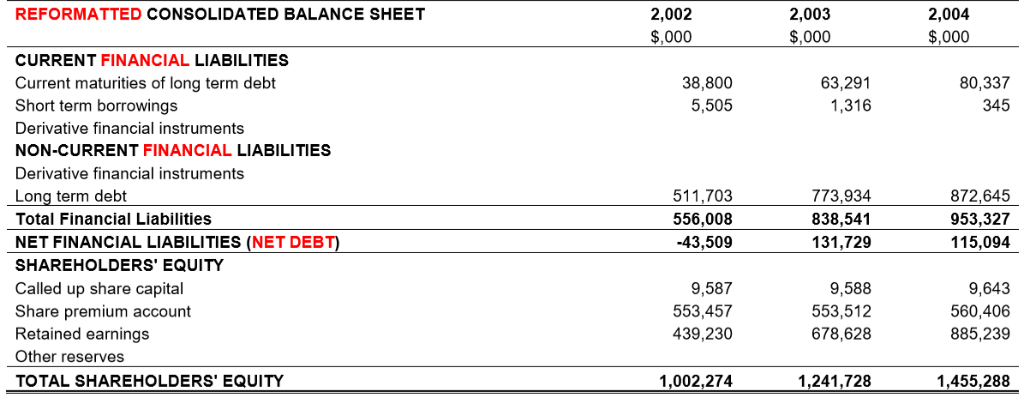


For 2004, use the reformatted financial statements below to compute the return on equity. Next compute the five Advanced du Pont ratios, the spread, and the financing impact on return on equity. (Please do not average the balance sheet numbers.) Briefly identify the activity that is pushing down profitability 2,002 $,000 2,003 2,004 REFORMATTED CONSOLIDATED INCOME STATEMENT $,000 $,000 FOR THE YEAR ENDED 30 JUNE REVENUE AND OTHER INCOME Scheduled revenues 550,991 73,059 731,951 110,557 924,566 Other revenues 149,658 1,074,224 3,217 Revenue total 624,050 842,508 975 628 Foreign exchange realised gains Gain on disposal of fixed assets 527 Revenue and other income in total 625,552 843,136 1,077,441 EXPENDITURE Staff costs -78,240 93,073 -123,624 -59,010 -76,865 -101,391 Depreciation and amortization Amortisation of goodwill (Loss) on disposal of fixed assets -2,342 29 -409,096 Other expenses -323,867 -597,922 Expenditure in total Operating (Loss) Profit before income tax expense and net finance expense -825,288 -461,117 -579,063 164,435 264,073 252,153 Income tax benefit (expense) Other comprehensive income Net Profit After Tax (NOPAT) -19,220 24,985 30,155 0 145,215 239,088 221,998 Net Finance Expense after tax (NFEat) 5,160 310 -15,387 150,375 239,398 COMPREHENSIVE INCOME 206,611 REFORMATTED CONSOLIDATED BALANCE SHEET 2,002 2,003 $,000 2,004 $,000 $,000 CURRENT OPERATING ASSETS Cash and cash equivalents (Working cash) 299,758 353,406 419,117 14970 Accounts receivable 10331 14932 Other assets 11,035 16,370 19,251 Inventories 22,788 17,125 26,440 NON-CURRENT OPERATING ASSETS Intangible assets Tangible assets Total Operating Assets 44,499 951,806 1,576,526 1,352,361 1,290,055 1,759,895 2,100,765 CURRENT OPERATING LIABILITIES Accounts payables 46,779 61,604 67,936 217,108 338,208 Accrued expenses and other liabilities 251,328 Current tax payable NONCURRENT OPERATING LIABILITIES Provisions for liabilities and charges Deferred income tax liability 49,317 67,833 94,192 Accounts payable due after one year 18,086 5,673 30,047 Total Operating Liabilities 331,290 386,438 530,383 NET OPERATING ASSETS (NOA) 958,765 1,373,457 1,570,382 CURRENT FINANCIAL ASSETS Financial assets C 0 0 Cash and cash equivalents 599,517 706,812 838,233 NON-CURRENT FINANCIAL ASSETS Financial assets Total Financial Assets 599,517 706,812 838,233 REFORMATTED CONSOLIDATED BALANCE SHEET 2,002 2,003 2,004 $,000 $,000 $,000 CURRENT FINANCIAL LIABILITIES Current maturities of long term debt 38,800 63,291 80,337 345 Short term borrowings 5,505 1,316 Derivative financial instruments NON-CURRENT FINANCIAL LIABILITIES Derivative financial instruments Long term debt 511,703 773,934 872,645 838,541 953,327 Total Financial Liabilities 556,008 NET FINANCIAL LIABILITIES (NET DEBT) -43,509 131,729 115,094 SHAREHOLDERS' EQUITY Called up share capital Share premium account Retained earnings 9,587 9,588 9,643 553,512 560,406 553,457 439,230 678,628 885,239 Other reserves 1,002,274 TOTAL SHAREHOLDERS' EQUITY 1,241,728 1,455,288


