

Answered step by step
Verified Expert Solution
Question
1 Approved Answer
For 2013, what was the net cash inflow or outflow that Netflix realized associated with the issuance and/or repayment (i.e., redemption) of debt to investors?
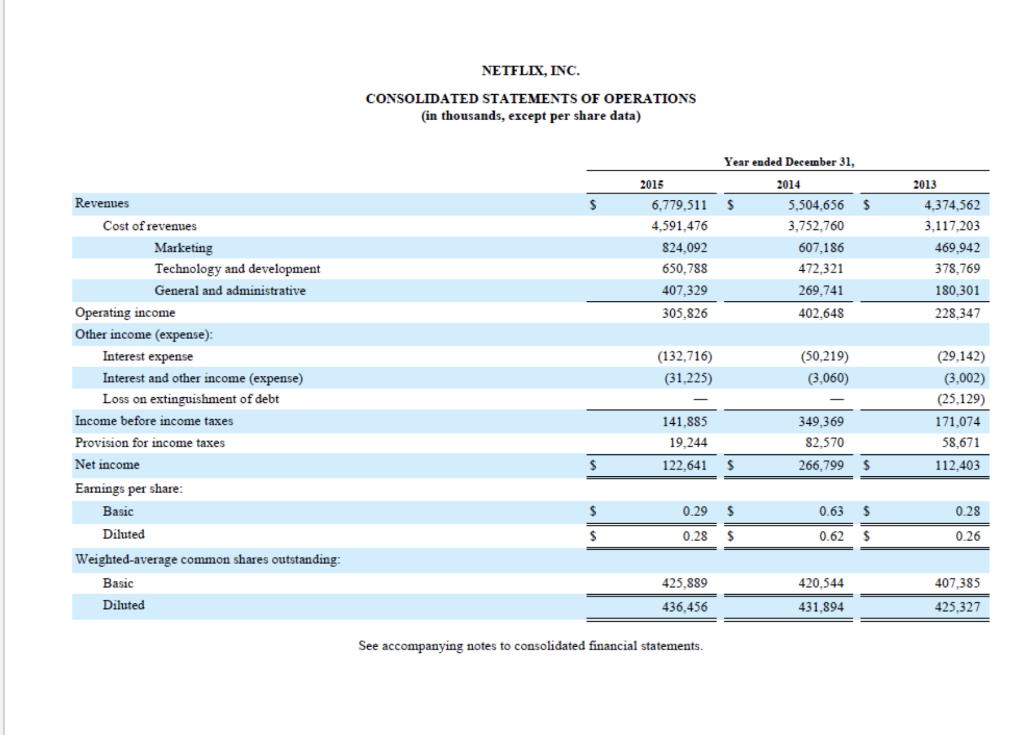
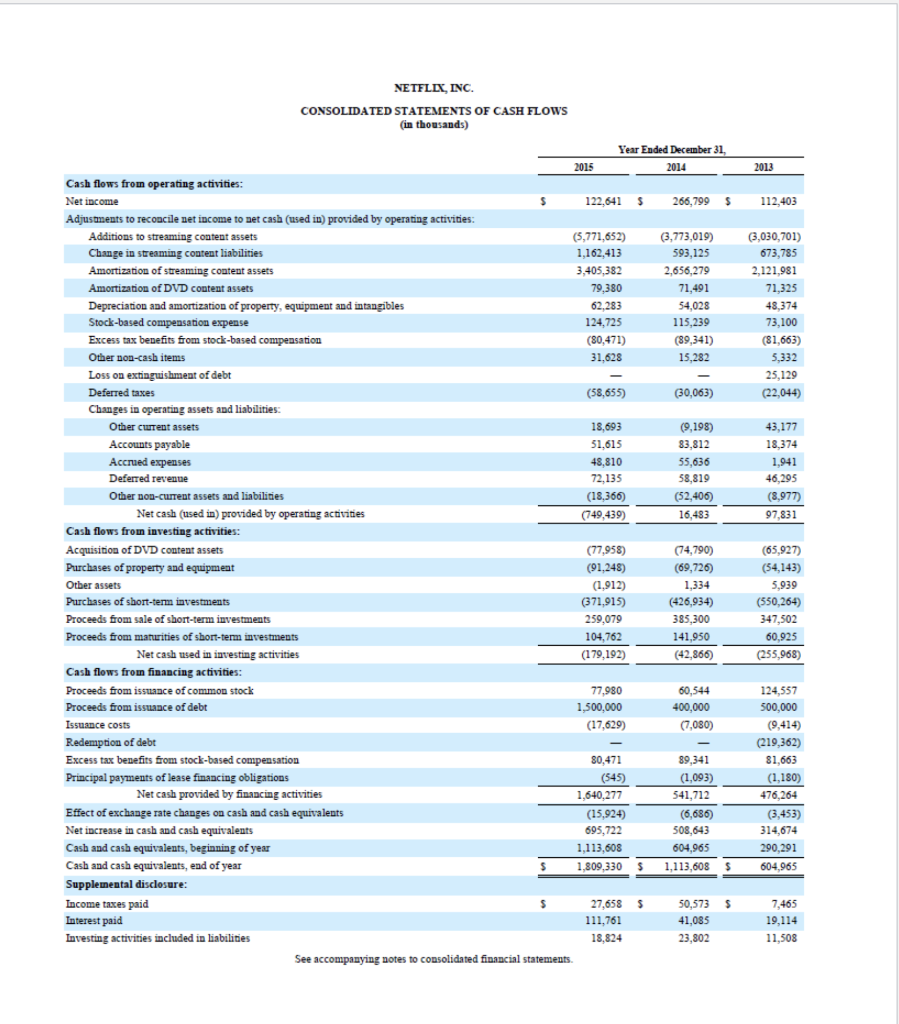
For 2013, what was the net cash inflow or outflow that Netflix realized associated with the issuance and/or repayment (i.e., redemption) of debt to investors? Ignore issuance costs.
NETFLIX, INC. CONSOLIDATED STATEMENTS OF OPERATIONS (in thousands, except per share data) Revenues $ $ 2015 6,779,511 4,591,476 824,092 650.788 2013 4.374.562 3,117,203 Year ended December 31, 2014 $ 5,504,656 3,752,760 607,186 472,321 269,741 402.648 469,942 407,329 305,826 378,769 180,301 228,347 (132,716) (50,219) (3,060) (31,225) Cost of revenues Marketing Technology and development General and administrative Operating income Other income (expense) Interest expense Interest and other income (expense) Loss on extinguishment of debt Income before income taxes Provision for income taxes Net income Earnings per share: Basic Diluted Weighted-average common shares outstanding: Basic Diluted (29.142) (3,002) (25,129) 171,074 58,671 112,403 141.885 19.244 122,641 349,369 82,570 266,799 $ $ $ 0.29 $ 0.63 $ 0.28 $ 0.28 $ 0.62 $ 0.26 425,889 436,456 420,544 431,894 407,385 425.327 See accompanying notes to consolidated financial statements 2013 112,403 (3,030,701) 673,785 2,121,981 71,325 48,374 73,100 (81,663) 5,332 25,129 (22,044) 43,177 18,374 1,941 46,295 (8,977) 97,831 NETFLIX, INC. CONSOLIDATED STATEMENTS OF CASH FLOWS in thousands) Year Ended December 31, 2015 2014 Cash flows from operating activities: Net income $ 122,6415 266,799 $ Adjustments to reconcile net income to net cash (used in) provided by operating activities: Additions to streaming content assets (5,771,652) (3,773,019) Change in streaming content liabilities 1,162,413 593,125 Amortization of streaming content assets 3,405,382 2,656,279 Amortization of DVD content assets 79,380 71,491 Depreciation and amortization of property, equipment and intangibles 62,283 54,028 Stock-based compensation expense 124,725 115,239 Excess tax benefits from stock-based compensation (80,471) (89,341) Other non-cash items 31,628 15,282 Loss on extinguishment of debt Deferred taxes (58,655) (30,063) Changes in operating assets and liabilities: Other current assets 18,693 (9,198) Accounts payable 51,615 83,812 Accrued expenses 48,810 55,636 Deferred revenue 72,135 58,819 Other non-current assets and liabilities (18,366) (52,406) Net cash (used in provided by operating activities (749,439) 16,483 Cash flows from investing activities: Acquisition of DVD content assets (77,958) (74,790) Purchases of property and equipment (91,248) (69,726) Other assets (1,912) 1,334 Purchases of short-term investments (371,915) (426,934) Proceeds from sale of short-term investments 259,079 385,300 Proceeds from maturities of short-term investments 104,762 141,950 Net cash used in investing activities (179,192) (42.866) Cash flows from financing activities: Proceeds from issuance of common stock 77,980 60,544 Proceeds from issuance of debt 1,500,000 400,000 Issuance costs (17,629) (7,080) Redemption of debt Excess tax benefits from stock-based compensation 80,471 89,341 Principal payments of lease financing obligations (545) (1,093) Net cash provided by financing activities 1,640,277 541,712 Effect of exchange rate changes on cash and cash equivalents (15,924) (6,686) Net increase in cash and cash equivalents 695,722 508,643 Cash and cash equivalents, beginning of year 1,113,608 604,965 Cash and cash equivalents, end of year $ 1,809,330 $ 1,113,608 $ Supplemental disclosure: Income taxes paid $ 27,658 5 50,5735 Interest paid 111,761 41,085 Investing activities included in liabilities 18,824 23,802 See accompanying notes to consolidated financial statements. (65,927) (54,143) 5,939 (550,264) 347,502 60,925 (255,968) 124,557 500,000 (9,414) (219,362) 81,663 (1,180) 476,264 (3,453) 314,674 290,291 604,965 7,465 19,114 11,508Step by Step Solution
There are 3 Steps involved in it
Step: 1

Get Instant Access to Expert-Tailored Solutions
See step-by-step solutions with expert insights and AI powered tools for academic success
Step: 2

Step: 3
Ace Your Homework with AI
Get the answers you need in no time with our AI-driven, step-by-step assistance
Get Started
Supply Chain Risk Management Applying Secure Acquisition Principles To Ensure A Trusted Technology Product Internal Audit And IT Audit
Authors: Ken Sigler, Dan Shoemaker, Anne Kohnke
1st Edition
1138197335, 978-1138197336