

Question
For 2015and 2016 calculate return on sales, asset turnover, return on assets?(ROA), ?leverage, return on common? ?stockholders' equity?(ROE), ?gross profit? ?percentage, operating income? ?percentage, and
For 2015and 2016 calculate return on sales, asset turnover, return on assets?(ROA), ?leverage, return on common? ?stockholders' equity?(ROE), ?gross profit? ?percentage, operating income? ?percentage, and earnings per share to measure the ability to earn profits for Rolling Hills ?Decor, ?Inc. Perform a DuPont Analysis for ROA and? ?ROE, and round each component ratio to three decimals? ?places; for other ratio? ?computations, round to two decimals. Did the? ?company's operating performance improve or deteriorate during 2018??
Rolling Hills Decor, Inc.?Comparative Income Statements?Years Ended December31,2015 ?and 2016?? ?
2018??
Net sales $250,000??
Cost of goods sold123,000??
Gross profit127,000????
Selling and general expenses55,000?
?Income from operations72,000??
Interest expense14,000??
Income before income tax58,000??
Income tax expense20,000??
Net income $38,000????
2017???
Net sales $199,000??
Cost of goods sold102,000??
Gross profit97,000??
Selling and general expenses51,000?
?Income from operations46,000??
Interest expense18,000??
Income before income tax28,000??
Income tax expense10,000??
Net income $18,000
Additional Info
2018
Total Assets $310,000
Common Stockholders' ?equity $196,000
Preferred Dividends $2000
Average Common Shares Outstanding during the year 15000?
?
2017
Total Assets $305,000
Common Stockholders' ?equity $194,000
Preferred Dividends $1000
Average Common Shares Outstanding during the year 14000
?
2016
Total Assets $300,000
Common Stockholders' ?equity $192,000
Preferred Dividends $0
Average Common Shares Outstanding during the year 13000
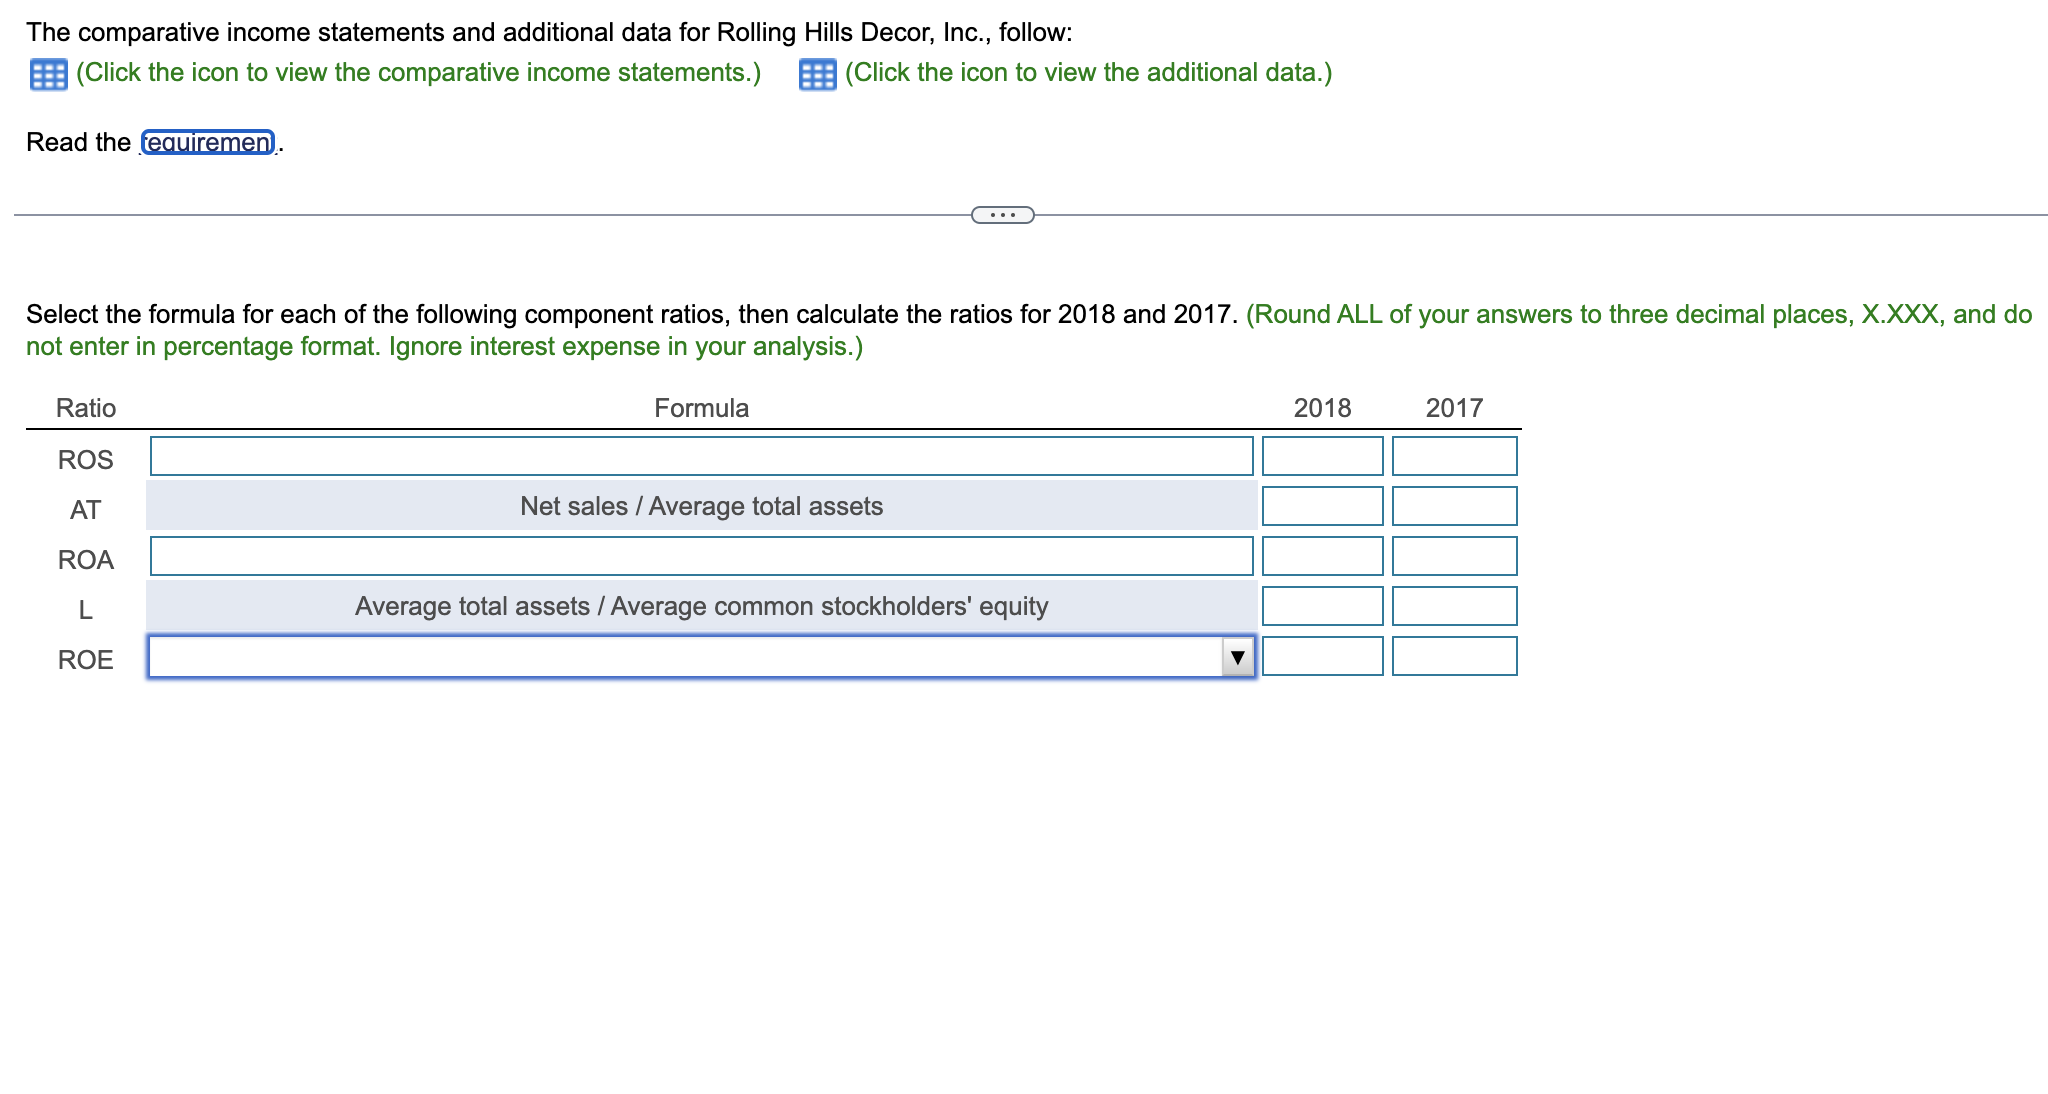
The comparative income statements and additional data for Rolling Hills Decor, Inc., follow: | (Click the icon to view the comparative income statements.) Read the requiremen (Click the icon to view the additional data.) Select the formula for each of the following component ratios, then calculate the ratios for 2018 and 2017. (Round ALL of your answers to three decimal places, X.XXX, and do not enter in percentage format. Ignore interest expense in your analysis.) Ratio ROS Formula 2018 2017 AT Net sales/Average total assets ROA L Average total assets / Average common stockholders' equity ROE
Step by Step Solution
There are 3 Steps involved in it
Step: 1

Get Instant Access with AI-Powered Solutions
See step-by-step solutions with expert insights and AI powered tools for academic success
Step: 2

Step: 3
Ace Your Homework with AI
Get the answers you need in no time with our AI-driven, step-by-step assistance
Get Started
A First Course in the Finite Element Method
Authors: Daryl L. Logan
6th edition
978-1305635111