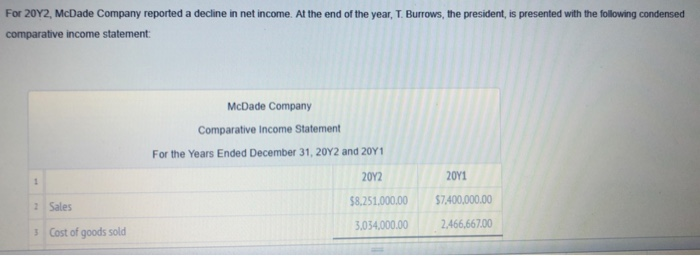
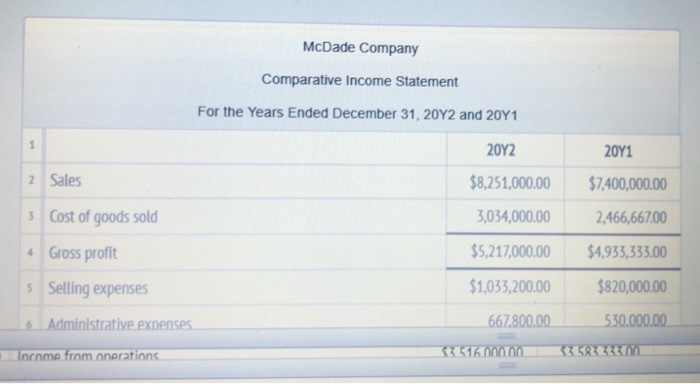
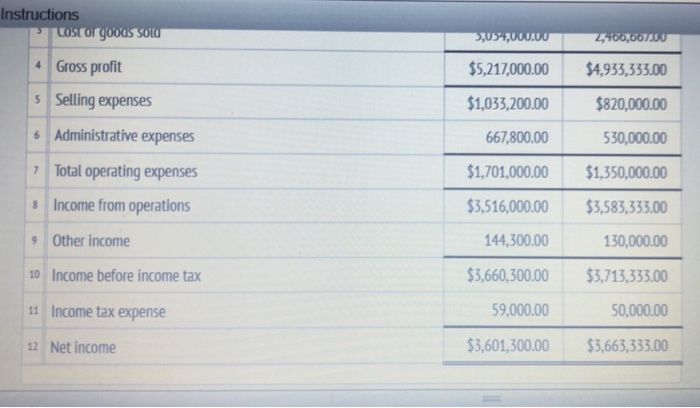
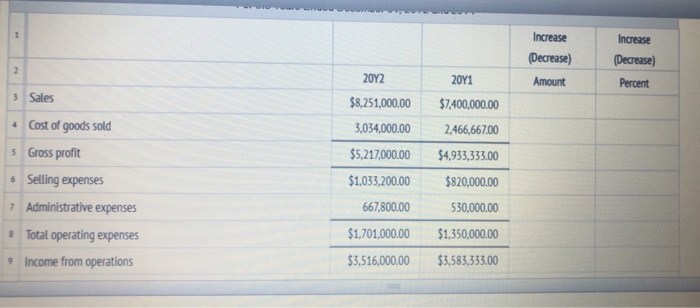
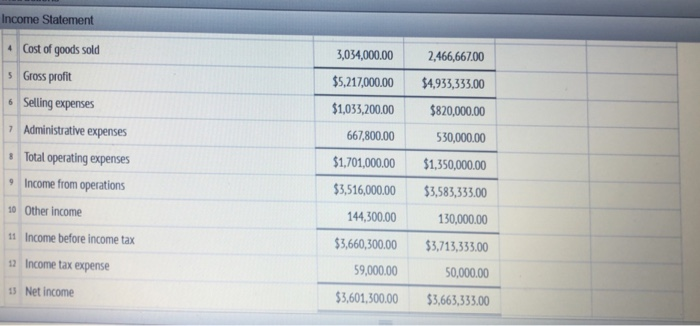
For 20Y2, McDade Company reported a decline in net income. At the end of the year, T. Burrows, the president, is presented with the following condensed comparative income statement McDade Company Comparative Income Statement For the Years Ended December 31, 20Y2 and 20Y 20Y1 20Y2 8.251,000.00 $7,400,000.00 2 Sales 034,000.00 2.466,66700 Cost of goods sold McDade Company Comparative Income Statement For the Years Ended December 31, 20Y2 and 20Y1 20Y2 20Y1 2 Sales 8,251,000.00 $7,400,000.00 ,034,000.00 2,466,667.00 5,217,000.00 $4,933,333.00 1,033,200.00 $820,000.00 667.800.00 530.000.00 Cost of goods sold 4 Gross profit s Selling expenses ncome from onerations Instructions 4Gross proft 5 Selling expenses 6 Administrative expenses 7 Total operating expenses 8 Income from operations 5,217,000.00 $4933,333.00 1,033,200.00 $820,000.00 530,000.00 1,701,000.00 $1,350,000.00 3,516,000.00 $3,583,333.00 130,000.00 $3,660,300.00 $3,713,333.00 50,000.00 3,601,300.00 $3,663,333.00 667,800.00 44,300.00 Other income 10 Income before income tax 11 Income tax expense 12 Net income 59,000.00 Increase Decrease) (Decrease) Amount ncrease 20Y2 Percent 20Y1 8,251000.00$7,400,000.00 034,000.00 2,466,667.00 5,217000.00 $4,933,333.00 1,033200.00 $820,000.00 530,000.00 1,701,000.00 $1,350,000.00 3,516,000.00 $3,583,333.00 Sales Cost of goods sold 5 Gross proft 6Selling expenses 7 Administrative expenses 667,800.00 Total operating expenses 9 Income from operations Income Statement ,034,000.002,466,667.00 5,217000.00 $4,933,333.00 1033,200.00 $820,000.00 30,000.00 1,701,000.00 $1,350,000.00 3,516,000.00 $3,583,333.00 30,000.00 3,660,300.00 $3,713,333.00 4 Cost of goods sold S Gross profit 6 Selling expenses 667,800.00 Administrative expenses Total operating expenses Income from operations Other income 144,300.00 1 Income before income tax 2Income tax expense 15 Net income 59,000.00 50,000.00 3,601,300.00 $3,663,333.00 To the extent the data permit, comment on the significant relationships revealed by the horizontal analysis prepared in (1) Net income has from 20Y1 to 20Y2 Sales have ; however, the cost of goods sold has by a percentage, causing the gross proft to pace than sales, causing net income to at a slower pace than sales in addition, total operating expenses have ata