

Answered step by step
Verified Expert Solution
Question
1 Approved Answer
For a line chart involving time in years and dollar values, the horizontal or x - axis would be used to represent a . the
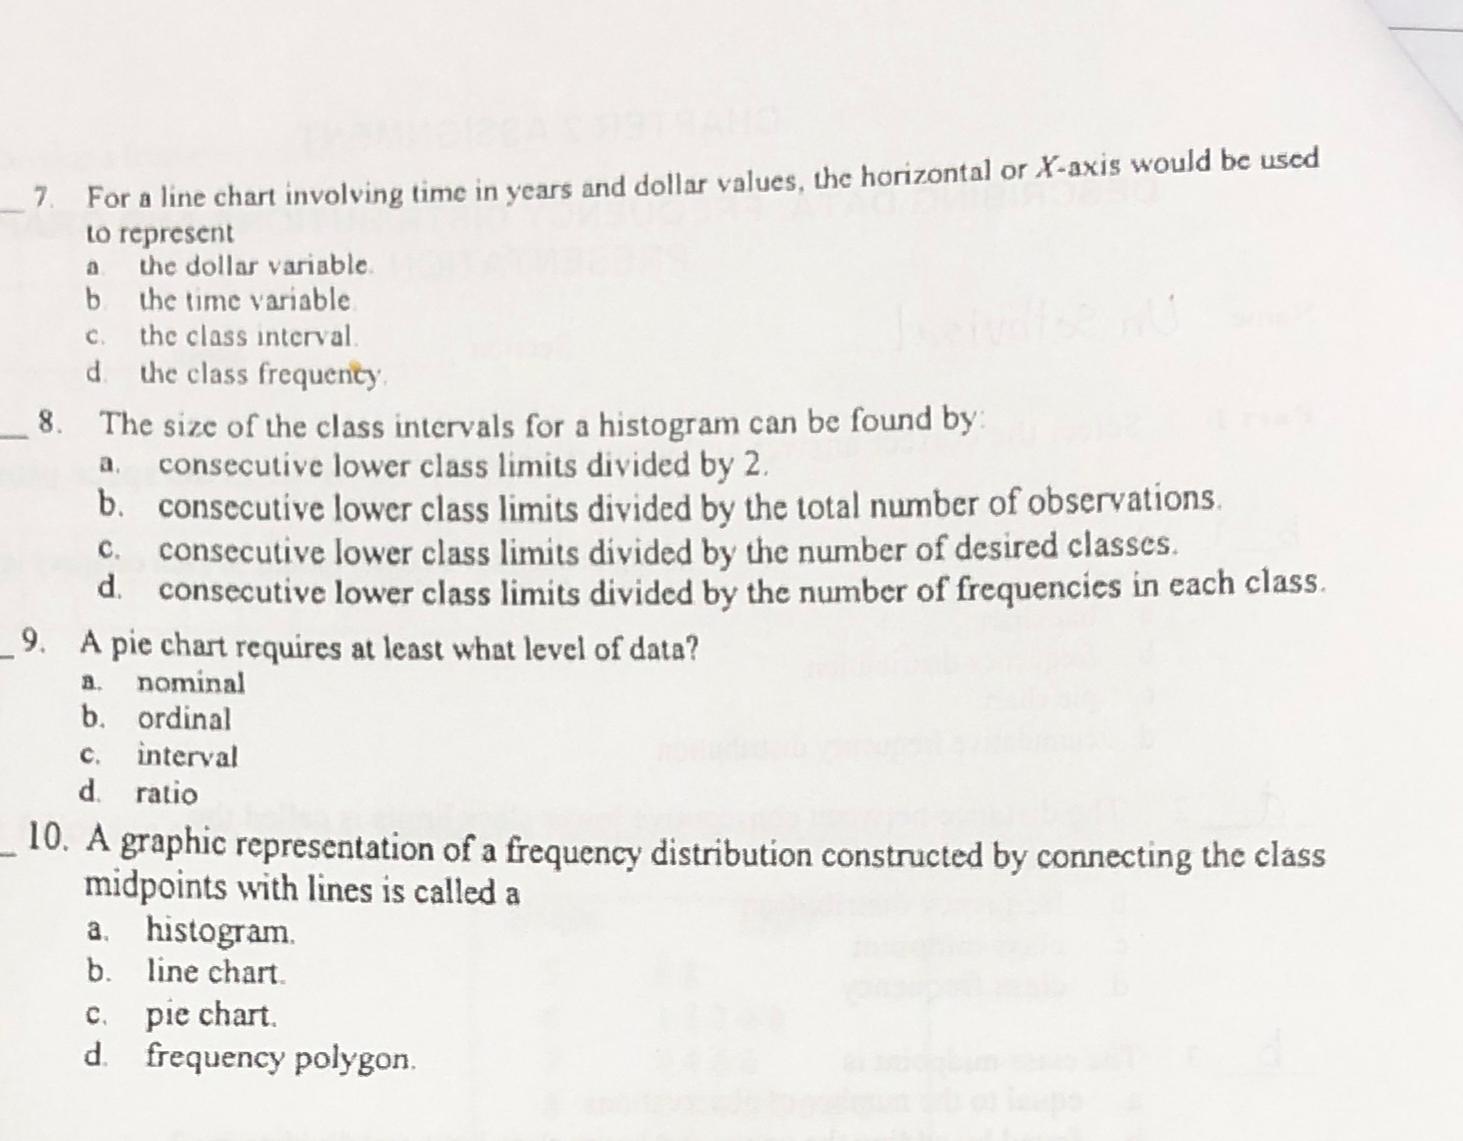
For a line chart involving time in years and dollar values, the horizontal or axis would be used to represent
a the dollar variable.
b the time variable
c the class interval.
d the class frequenty.
The size of the class intervals for a histogram can be found by:
a consecutive lower class limits divided by
b consecutive lower class limits divided by the total number of observations.
c consecutive lower class limits divided by the number of desired classes.
d consecutive lower class limits divided by the number of frequencies in each class.
A pie chart requires at least what level of data?
a nominal
b ordinal
c interval
d ratio
A graphic representation of a frequency distribution constructed by connecting the class midpoints with lines is called a
a histogram.
b line chart.
c pie chart.
d frequency polygon.
Step by Step Solution
There are 3 Steps involved in it
Step: 1

Get Instant Access to Expert-Tailored Solutions
See step-by-step solutions with expert insights and AI powered tools for academic success
Step: 2

Step: 3
Ace Your Homework with AI
Get the answers you need in no time with our AI-driven, step-by-step assistance
Get Started
Elementary Statisitcs
Authors: Barry Monk
2nd edition
1259345297, 978-0077836351, 77836359, 978-1259295911, 1259295915, 978-1259292484, 1259292487, 978-1259345296