

Question
FOR ALL CALCULATIONS OF THE MONEY SUPPLY USETHE EXPRESSION THAT WE DERIVED: THE MONEY MULTIPLIER x THE MONETARY BASE. DO NOT USE THE SIMPLE C
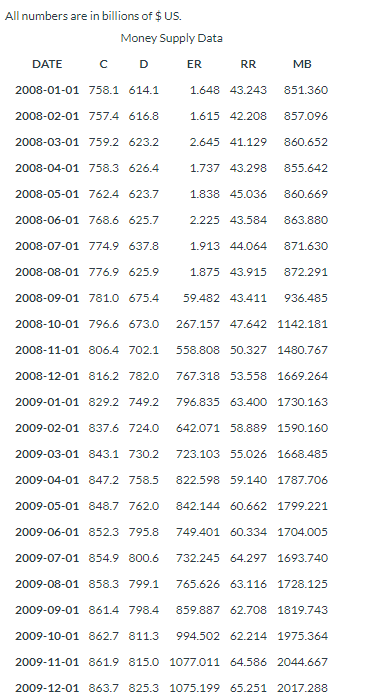
FOR ALL CALCULATIONS OF THE MONEY SUPPLY USETHE EXPRESSION THAT WE DERIVED: THE MONEY MULTIPLIER x THE MONETARY BASE. DO NOT USE THE SIMPLE C + D DEFINITION TO CALCULATE MONEY SUPPLY. IN THEORY THEY ARE THE SAME, EMPIRICALLY, DUE TO LACK OF COMPLETE DATA, THEY DIFFER SLIGHTLY.
a) (5 points) Calculate the money multiplier and the money supply forJune of 2008 (2008-06-01)
b) (5 points) Calculate the money multiplier and the money supply forJune of 2009 (2009-06-01).
c) (10 points - 5 for each explanation) Explain why:
1) the money multiplier is so different and
2) why the monetary base is so different between these two periods.
d) (5 points) Calculate what the money supply would have been if the Fed increased the monetary base as they did from June of 2008 to June of 2009 but the money multiplier remained at its value in June of 2008.
e) (5 points) Given the conditions that prevailed during June of 2009, suppose the Fed wanted to increase the money supply by 10% from its value in June of 2009. What type and how many open market operations would they need to conduct?
PLEASE type your answers to this question in the box below.You must show all work for full credit
Step by Step Solution
There are 3 Steps involved in it
Step: 1

Get Instant Access to Expert-Tailored Solutions
See step-by-step solutions with expert insights and AI powered tools for academic success
Step: 2

Step: 3
Ace Your Homework with AI
Get the answers you need in no time with our AI-driven, step-by-step assistance
Get Started
Econometric Analysis
Authors: William H. Greene
5th Edition
130661899, 978-0130661890