For all questions, you must submit the formula that you used in column B, NOT the result. For instance, the 2018 birth rate for Estonia is 11. Do not submit 11. Submit the Excel formula you wrote that produced 11. (The inputs in column A are given only as examples to help you check that your formula is doing what its supposed to do.)
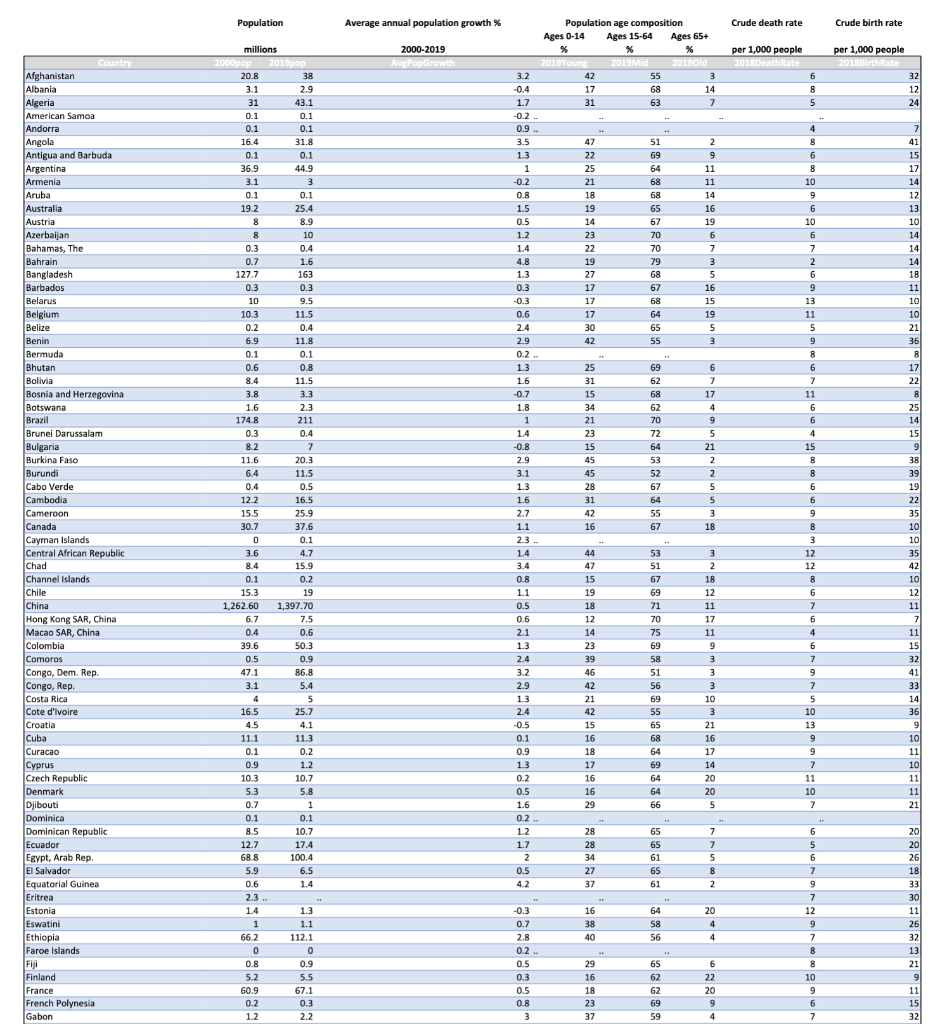
- Write a formula using a VLOOKUP or XLOOKUP function that retrieves the 2018 birth rate of the country in cell A4.
- Write an AVERAGEIF function that calculates the average percentage of people under 15 in a country ("2019Young") for only those countries whose 2019 population in millions (2019pop) is greater than or equal to the number in cell A6.
- After you have finished the previous question, try entering a few different values into cell A6. How does the result change? What does this tell you about the relationship between a countrys population and the percentage of people under 15 in the country?
- Write a formula using COUNTIF to determine how many entries in the "2019Young" column are the text in cell A9.
population Population Average annual population growth % Crude death rate Crude birth rate 2000-2019 AvgPop Growth Population age composition Ages 0-14 Ages 15-64 Ages 65+ % % 2019 Young 019 Mid 2019Old 42 55 3 17 68 14 31 63 7 7 per 1,000 people 2018 DeathRate per 1,000 people 2018BirthRate 3.2 -0.4 1.7 -0.2 6 8 5 32 12 24 0.1 0.9 7 47 41 51 69 2 9 11 3.5 1.3 1 -0.2 0.8 1.5 0.5 1.2 1.4 4.8 1.3 22 25 21 18 19 14 64 68 68 11 14 16 19 4 8 6 8 10 9 6 10 6 6 23 6 7 3 65 67 70 70 79 68 67 68 64 65 55 7 2 6 9 22 19 27 17 17 17 30 42 0.3 -0.3 0.6 5 16 15 19 5 3 3 13 11 2.4 2.9 0.2 - 5 9 9 8 6 7 11 6 6 1.3 1.6 -0.7 1.8 1 1.4 -0.8 2.9 3.1 1.3 1.6 2.7 1.1 69 62 68 62 70 72 64 53 25 31 15 34 21 23 15 45 45 28 31 42 16 millions 2000pop op 2019pop 20.8 38 3.1 2.9 31 43.1 0.1 0.1 0.1 16.4 31.8 0.1 0.1 36.9 44.9 3.1 3 3 0.1 0.1 19.2 25.4 8 8.9 8 10 0.3 0.4 0.7 1.6 127.7 163 0.3 0.3 10 9.5 10.3 11.5 0.2 0.4 6.9 11.8 0.1 0.1 0.6 0.8 8.4 11.5 3.8 3.3 1.6 2.3 174.8 211 0.3 0.4 8.2 7 11.6 20.3 6.4 11.5 0.4 0.5 12.2 16.5 15.5 25.9 30.7 37.6 0 0 0.1 3.6 4.7 8.4 15.9 0.1 0.2 15.3 19 1,262.60 1,397.70 6.7 7.5 0.4 0.6 39.6 50.3 0.5 0.9 47.1 86.8 3.1 5.4 4 5 16.5 25.7 4.5 4.1 11.1 11.3 0.1 0.2 0.9 1.2 10.3 10.7 5.3 5.8 0.7 1 0.1 0.1 8.5 10.7 12.7 17.4 68.8 100.4 5.9 6.5 0.6 1.4 6 7 17 4 9 5 21 2 2 5 4 15 8 8 52 67 15 17 14 12 13 10 14 14 14 18 11 10 10 21 36 8 17 22 8 25 14 15 9 9 38 39 19 22 35 10 10 35 42 10 12 11 7 11 15 32 41 33 14 36 9 10 11 10 11 11 21 64 5 3 Country Afghanistan Albania Algeria American Samoa Andorra Angola Antigua and Barbuda Argentina Armenia Aruba Australia Austria Azerbaijan Bahamas, The Bahrain Bangladesh Barbados Belarus Belgium Belize Benin Bermuda Bhutan Bolivia Bosnia and Herzegovina Botswana Brazil Brunei Darussalam Bulgaria Burkina Faso Burundi Cabo Verde Cambodia Cameroon Canada Cayman Islands Central African Republic Chad Channel Islands Chile China Hong Kong SAR, China Macao SAR, China Colombia Comoros Congo, Dem. Rep. Congo, Rep. Costa Rica Cote d'Ivoire Croatia Cuba Curacao Cyprus Czech Republic Denmark Djibouti Dominica Dominican Republic Ecuador Egypt, Arab Rep. El Salvador Equatorial Guinea Eritrea Estonia Eswatini Ethiopia Faroe Islands Fiji Finland France French Polynesia Gabon 55 67 18 2.3 44 1.4 3.4 3 2 53 51 67 69 6 6 9 8 3 3 12 12 8 6 7 7 6 4 18 12 0.8 1.1 0.5 0.6 2.1 1.3 2.4 3.2 2.9 1.3 2.4 -0.5 47 15 19 18 12 14 23 39 46 42 21 42 15 16 71 70 75 69 58 51 56 69 55 11 17 11 9 9 3 3 3 3 10 3 21 16 17 14 20 20 5 6 7 9 7 7 5 10 13 65 68 0.1 0.9 64 69 1.3 0.2 0.5 1.6 18 17 16 16 29 64 64 66 9 9 7 7 11 10 7 0.2 - 6 20 65 65 1.2 1.7 2 0.5 28 28 34 27 37 7 7 5 61 65 61 5 6 7 9 8 2 4.2 2.3 - -0.3 64 0.7 16 38 40 58 56 20 4 4 4 2.8 1.4 1 66.2 0 0.8 5.2 60.9 0.2 1.2 20 26 18 33 30 11 26 32 13 21 9 11 15 32 1.3 1.1 112.1 0 0.9 5.5 67.1 0.3 2.2 0.2 - 7 12 9 7 8 8 10 9 9 65 62 0.5 0.3 0.5 0.8 3 3 29 16 18 23 37 6 22 20 9 62 69 6 59 4 7