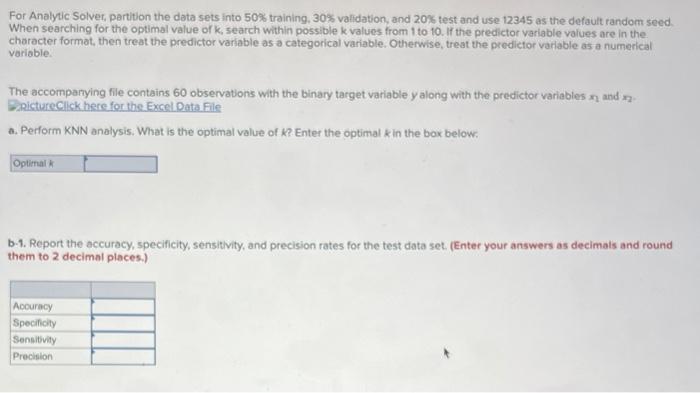
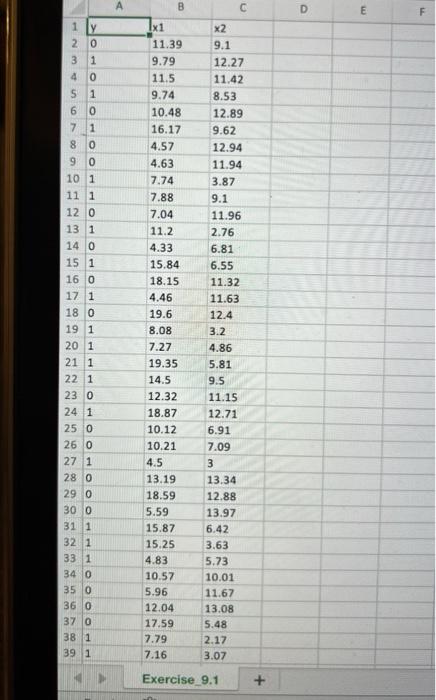
For Analytic Solver, partition the data sets into 50% training, 30% validation, and 20% test and use 12345 as the default random seed. When searching for the optimal value of k, search within possible k values from 1 to 10 . If the predictor variable values are in the. character format, then treat the predictor variable as a categorical variable. Otherwise, treat the predictor variable as a numerical variable. The accomparying file contains 60 observations with the binary target variable y along with the predictor variables x2 and x2. ZsictureClick here for the Excel Data File a. Perform KNN analysis. What is the optimal value of k ? Enter the optimal k in the box below: b-1. Report the accuracy, specificity, sensitivity, and precision rates for the test data set. (Enter your answers as decimals and round them to 2 decimal places.) b-2. Which of the following statements is least accurate? A. The error rate of the KNN model is 26%. B. The KNN model is able to correctly classify 100% of the Class 1 cases. C. The KNN model is able to correctly classify 67% of the Class 0 cases. D. Overall, the KNN model is able to correctly classify 75% of the cases. \begin{tabular}{|l|l|l|l|} \hline & \multicolumn{2}{|c|}{ A } & \multicolumn{1}{|c|}{} \\ \cline { 1 - 5 } & y & x & \\ \hline 2 & 0 & 11.39 & 9.1 \\ \hline 3 & 1 & 9.79 & 12.27 \\ \hline 4 & 0 & 11.5 & 11.42 \\ \hline 5 & 1 & 9.74 & 8.53 \\ \hline 6 & 0 & 10.48 & 12.89 \\ \hline 7 & 1 & 16.17 & 9.62 \\ \hline 8 & 0 & 4.57 & 12.94 \\ \hline 9 & 0 & 4.63 & 11.94 \\ \hline 10 & 1 & 7.74 & 3.87 \\ \hline 11 & 1 & 7.88 & 9.1 \\ \hline 12 & 0 & 7.04 & 11.96 \\ \hline 13 & 1 & 11.2 & 2.76 \\ \hline 14 & 0 & 4.33 & 6.81 \\ \hline 15 & 1 & 15.84 & 6.55 \\ \hline 16 & 0 & 18.15 & 11.32 \\ \hline 17 & 1 & 4.46 & 11.63 \\ \hline 18 & 0 & 19.6 & 12.4 \\ \hline 19 & 1 & 8.08 & 3.2 \\ \hline 20 & 1 & 7.27 & 4.86 \\ \hline 21 & 1 & 19.35 & 5.81 \\ \hline 22 & 1 & 14.5 & 9.5 \\ \hline 23 & 0 & 12.32 & 11.15 \\ \hline 24 & 1 & 18.87 & 12.71 \\ \hline 25 & 0 & 10.12 & 6.91 \\ \hline 26 & 0 & 10.21 & 7.09 \\ \hline 27 & 1 & 4.5 & 3 \\ \hline 28 & 0 & 13.19 & 13.34 \\ \hline 29 & 0 & 18.59 & 12.88 \\ \hline 30 & 0 & 5.59 & 13.97 \\ \hline 31 & 1 & 15.87 & 6.42 \\ \hline 32 & 1 & 15.25 & 3.63 \\ \hline 33 & 1 & 4.83 & 5.73 \\ \hline 34 & 0 & 10.57 & 10.01 \\ \hline 35 & 0 & 5.96 & 11.67 \\ \hline 36 & 12.04 & 13.08 \\ \hline \end{tabular}