

Question
for b) clear clc close all %Enter important times below ts=[]; % Enter queue length at specified times qts=[]; % Code below makes the plot
 for b)
clear
clc close all
%Enter important times below ts=[];
% Enter queue length at specified times qts=[];
% Code below makes the plot figure(1) stairs(ts,qts) ylim([0 3]) title('') xlabel('') ylabel('')
% As guidence consider the example below ex_ts=[0 2 4.5 6 8.3 10 12 15 17.8 20]; ex_qts=[0 1 0 1 2 3 2 1 0 1]; figure(2) stairs(ex_ts,ex_qts) ylim([0 max(ex_qts)+1]) title('Example Stair Plot') xlabel('Time [Units]') ylabel('Example Y-label')
for c)
clear clc close all
%Enter important times below ts=[];
% Enter queue length at specified times qts=[];
% Code below makes the plot figure(1) stairs(ts,qts) ylim([0 3]) title('') xlabel('') ylabel('')
% As guidence consider the example below ex_ts=[0 2 4.5 6 8.3 10 12 15 17.8 20]; ex_qts=[0 1 0 1 2 3 2 1 0 1]; figure(2) stairs(ex_ts,ex_qts) ylim([0 max(ex_qts)+1]) title('Example Stair Plot') xlabel('Time [Units]') ylabel('Example Y-label')
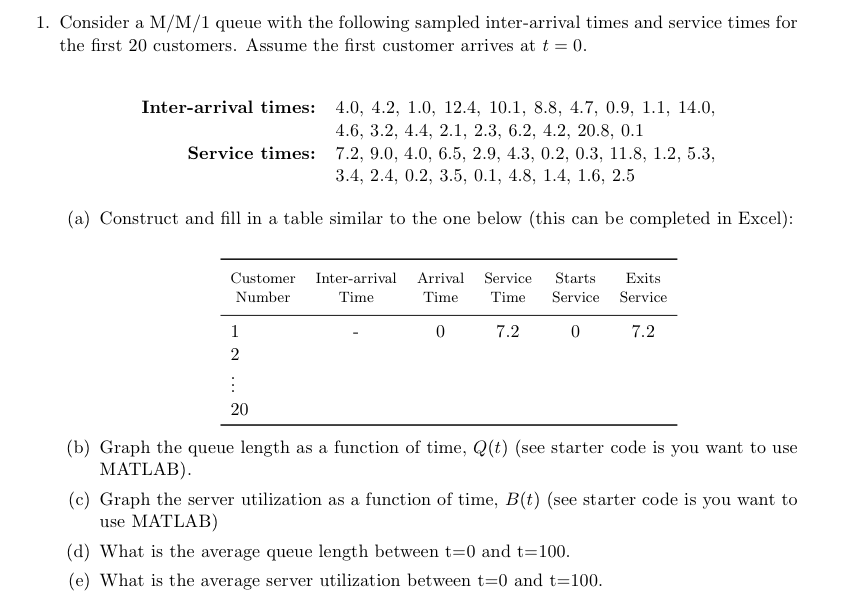
Consider a M/M/1 queue with the following sampled inter-arrival times and service times for the first 20 customers. Assume the first customer arrives at t = 0. Inter-arrival times: 4.0, 4.2, 1.0, 12.4, 10.1, 8.8, 4.7, 0.9, 1.1, 14.0, 4.6, 3.2, 4.4, 2.1, 2.3, 6.2, 4.2, 20.8, 0.1 Service times: 7.2, 9.0, 4.0, 6.5, 2.9, 4.3, 0.2, 0.3, 11.8, 1.2, 5.3, 3.4, 2.4, 0.2, 3.5, 0.1, 4.8, 1.4, 1.6, 2.5 (a) Construct and fill in a table similar to the one below (this can be completed in Excel): (b) Graph the queue length as a function of time Q (t) (see starter code is you want to use MATLAB). (c) Graph the server utilization as a function of time, B(t) see starter code is you want to use MATLAB) (d) What is the average queue length between t = 0 and t = 100. (e) What is the average server utilization between t = 0 and t = 100. Consider a M/M/1 queue with the following sampled inter-arrival times and service times for the first 20 customers. Assume the first customer arrives at t = 0. Inter-arrival times: 4.0, 4.2, 1.0, 12.4, 10.1, 8.8, 4.7, 0.9, 1.1, 14.0, 4.6, 3.2, 4.4, 2.1, 2.3, 6.2, 4.2, 20.8, 0.1 Service times: 7.2, 9.0, 4.0, 6.5, 2.9, 4.3, 0.2, 0.3, 11.8, 1.2, 5.3, 3.4, 2.4, 0.2, 3.5, 0.1, 4.8, 1.4, 1.6, 2.5 (a) Construct and fill in a table similar to the one below (this can be completed in Excel): (b) Graph the queue length as a function of time Q (t) (see starter code is you want to use MATLAB). (c) Graph the server utilization as a function of time, B(t) see starter code is you want to use MATLAB) (d) What is the average queue length between t = 0 and t = 100. (e) What is the average server utilization between t = 0 and t = 100Step by Step Solution
There are 3 Steps involved in it
Step: 1

Get Instant Access to Expert-Tailored Solutions
See step-by-step solutions with expert insights and AI powered tools for academic success
Step: 2

Step: 3
Ace Your Homework with AI
Get the answers you need in no time with our AI-driven, step-by-step assistance
Get Started
Databases In Telecommunications International Workshop Co Located With Vldb 99 Edinburgh Scotland Uk September 1999 Proceedings Lncs 1819
Authors: Willem Jonker
2000th Edition
3540676678, 978-3540676676