Answered step by step
Verified Expert Solution
Link Copied!

Question

1 Approved Answer

For each graph detemine what statistics, if any, were used to create the figure? student's t-test? anova? if there are error bars, are they sem

For each graph detemine what statistics, if any, were used to create the figure? student's t-test? anova? if there are error bars, are they sem or standard deviation? how many samples were used? Name the method (i.e. western blot, immunostaining, uv-vis, etc.) and describe the principle behind the method?
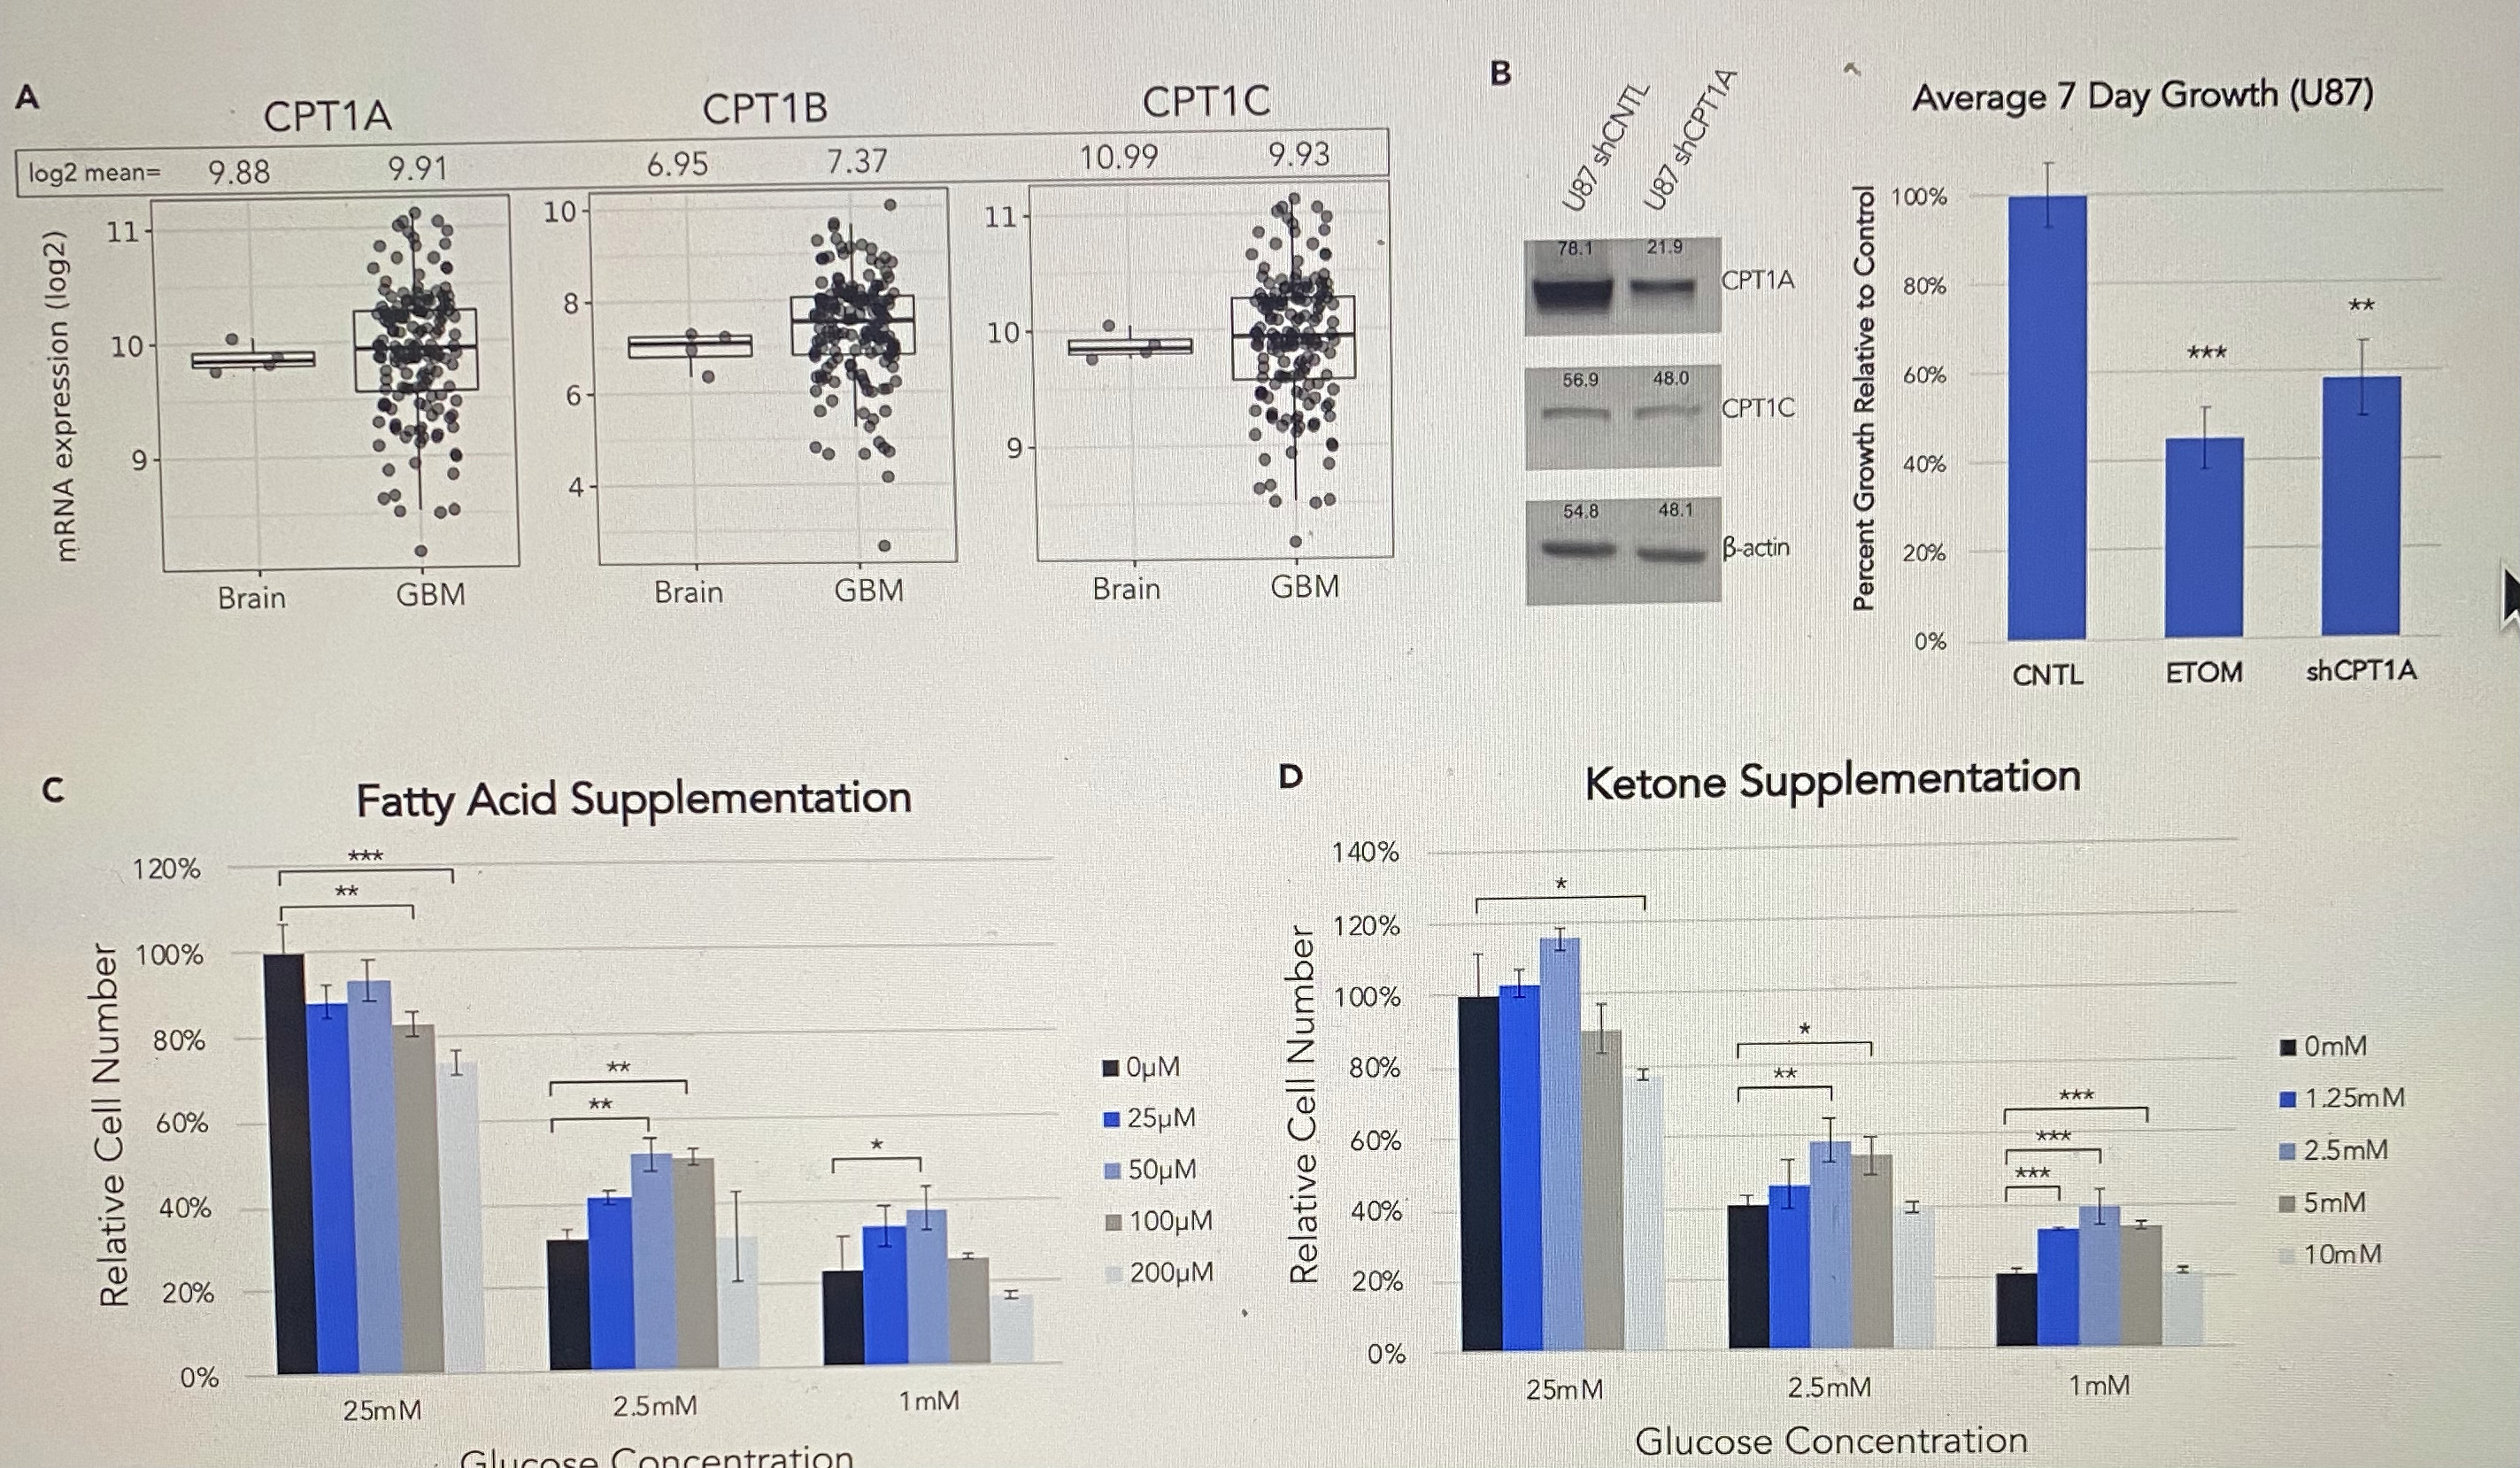
image text in transcribed
A CPT1B B CPT1A CPT10 Average 7 Day Growth (U87) log2 mean= 9.88 9.91 6.95 7.37 10.99 9.93 U87 sheNTL U87 shePT1A 10 11 11 100% 78.1 21.9 8 CPT1A 80% 10 10- * * MRNA expression (log2) 56.9 48.0 50% CPT1C Percent Growth Relative to Control 9 4 40% 54.8 48.1 B-actin 20% Brain GBM Brain GBM Brain GBM 0% CNTL ETOM shCPT1A C Fatty Acid Supplementation D Ketone Supplementation 120% * ** 140% * * 100% 120% 100% 80% * * OUM 30% 10mM * * Relative Cell Number Relative Cell Number 60% 25UM 1.25mM 50% 50UM 2.5mM 40% 100UM 40% 5mM 20% 200UM 20% 10mM 0% 0% 25mM 2.5mM 1 mM 25m M 2.5mM 1 mM Glucose Concentration

Step by Step Solution

There are 3 Steps involved in it

Step: 1

blur-text-image

Get Instant Access to Expert-Tailored Solutions

See step-by-step solutions with expert insights and AI powered tools for academic success

Step: 2

blur-text-image_2

Step: 3

blur-text-image_3

Ace Your Homework with AI

Get the answers you need in no time with our AI-driven, step-by-step assistance

Get Started

Recommended Textbook for

Algebra And Trigonometry Enhanced With Graphing Utilities (Subscription)

Authors: Michael, Michael Sullivan III, Michael III Sullivan, Michael Sullivan 111, III Sullivan

6th Edition

0321849132, 9780321849137

More Books

Students also viewed these Mathematics questions