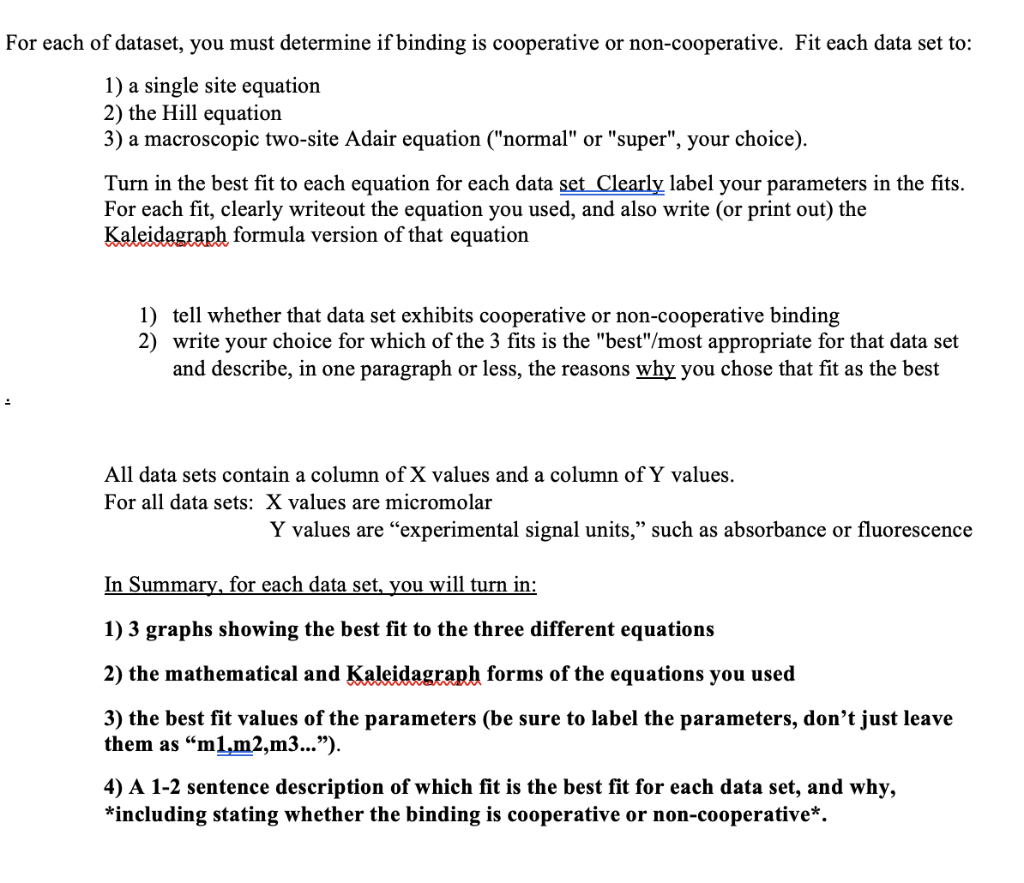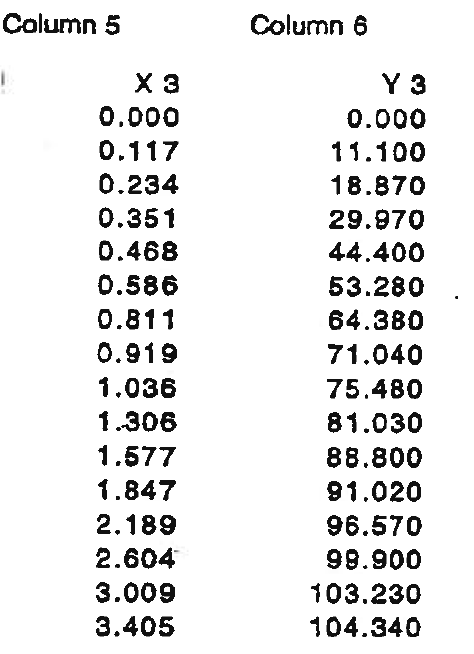

For each of dataset, you must determine if binding is cooperative or non-cooperative. Fit each data set to: 1) a single site equation 2) the Hill equation 3) a macroscopic two-site Adair equation ("normal" or "super", your choice). Turn in the best fit to each equation for each data set Clearly label your parameters in the fits. For each fit, clearly writeout the equation you used, and also write (or print out) the Kaleidagraph formula version of that equation 1) tell whether that data set exhibits cooperative or non-cooperative binding 2) write your choice for which of the 3 fits is the "best"/most appropriate for that data set and describe, in one paragraph or less, the reasons why you chose that fit as the best All data sets contain a column of X values and a column of Y values. For all data sets: X values are micromolar Y values are "experimental signal units, such as absorbance or fluorescence In Summary, for each data set, you will turn in: 1) 3 graphs showing the best fit to the three different equations 2) the mathematical and Kaleidagraph forms of the equations you used 3) the best fit values of the parameters (be sure to label the parameters, don't just leave them as "m1.m2,m3...). 4) A 1-2 sentence description of which fit is the best fit for each data set, and why, *including stating whether the binding is cooperative or non-cooperative*. Column 5 Column 6 1 0.000 0.117 0.234 0.351 0.468 0.586 0.811 0.919 1.036 1.306 1.577 1.847 2.189 2.604 3.009 3.405 Y 3 0.000 11.100 18.870 29.970 44.400 53.280 64.380 71.040 75.480 81.030 88.800 91.020 96.570 99.900 103.230 104.340 For each of dataset, you must determine if binding is cooperative or non-cooperative. Fit each data set to: 1) a single site equation 2) the Hill equation 3) a macroscopic two-site Adair equation ("normal" or "super", your choice). Turn in the best fit to each equation for each data set Clearly label your parameters in the fits. For each fit, clearly writeout the equation you used, and also write (or print out) the Kaleidagraph formula version of that equation 1) tell whether that data set exhibits cooperative or non-cooperative binding 2) write your choice for which of the 3 fits is the "best"/most appropriate for that data set and describe, in one paragraph or less, the reasons why you chose that fit as the best All data sets contain a column of X values and a column of Y values. For all data sets: X values are micromolar Y values are "experimental signal units, such as absorbance or fluorescence In Summary, for each data set, you will turn in: 1) 3 graphs showing the best fit to the three different equations 2) the mathematical and Kaleidagraph forms of the equations you used 3) the best fit values of the parameters (be sure to label the parameters, don't just leave them as "m1.m2,m3...). 4) A 1-2 sentence description of which fit is the best fit for each data set, and why, *including stating whether the binding is cooperative or non-cooperative*. Column 5 Column 6 1 0.000 0.117 0.234 0.351 0.468 0.586 0.811 0.919 1.036 1.306 1.577 1.847 2.189 2.604 3.009 3.405 Y 3 0.000 11.100 18.870 29.970 44.400 53.280 64.380 71.040 75.480 81.030 88.800 91.020 96.570 99.900 103.230 104.340


