

Question
For each of the data sets below, do the following: 1. Make a scatterplot of the data. 2. In a sentence or two, describe any
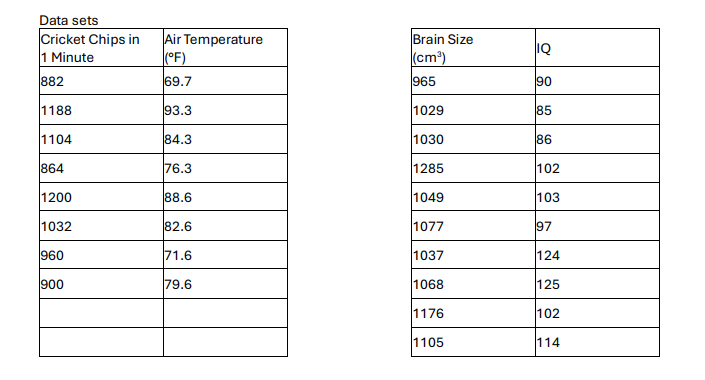
For each of the data sets below, do the following:
1. Make a scatterplot of the data.
2. In a sentence or two, describe any patterns or features you see in the data.
3. Calculate the least squares regression line for the data and write it in slope-intercept form.
4. In a sentence or two, describe how well the least squares regression line fits the data.
5. Calculate the correlation coefficient r and the coefficient of determination r^2 .
6. In a sentence or two, describe what the correlation coefficient says about the linearity of the relationship in the data.
7. Calculate the residual of the 3rd data point.
8. Use the least squares regression line to make a prediction: a. For the first data set, predict the air temperature at 1050 cricket chirps. b. For the second data set, predict the IQ of a person whose brain size is 1100 cm3
Step by Step Solution
There are 3 Steps involved in it
Step: 1

Get Instant Access to Expert-Tailored Solutions
See step-by-step solutions with expert insights and AI powered tools for academic success
Step: 2

Step: 3
Ace Your Homework with AI
Get the answers you need in no time with our AI-driven, step-by-step assistance
Get Started